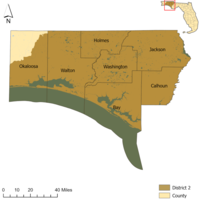
Florida's 2nd Senate district

| Florida's 2nd State Senate district | |||
|---|---|---|---|
 | |||
| Senator |
| ||
| Demographics | 75.2% White 10.2% Black 8.1% Hispanic 2.1% Asian 0.6% Native American 0.1% Hawaiian/Pacific Islander | ||
| Population (2020) | 526,550 | ||
Florida's 2nd Senate district elects one member of the Florida Senate. The district currently consists of Bay, Calhoun, Holmes, Jackson, Walton, Washington counties and part of Okaloosa county in the U.S. state of Florida. The current senator is Republican Jay Trumbull.
List of senators
[edit]NOTE: The following information was gathered from the Florida Senate website. Only records of senators from 1998–present are kept.
| Portrait | Name | Party | Years of service | Home city/state | Notes |
|---|---|---|---|---|---|
 | Democratic | 1992–2002 | Consisted of Parts of Alachua, Clay, Duval, Putnam and St. Johns county | ||
 | Republican | 2002–2010 | Consisted of Holmes, Washington counties and parts of Bay, Escambia, Okaloosa, Santa Rosa, Walton counties | ||
 | Republican | 2010–2016 | Consisted of Holmes, Washington counties and parts of Bay, Escambia, Okaloosa, Santa Rosa, Walton counties | ||
 | Republican | 2016–2022 | Consisted of Bay, Calhoun, Holmes, Jackson, Walton, Washington counties and part of Okaloosa county | ||
 | Republican | 2022–Present | Consists of Bay, Calhoun, Holmes, Jackson, Walton, Washington counties and part of Okaloosa county |
Elections
[edit]NOTE: The following results were gathered from the Florida Department of State. Uncontested election results are not provided.
1978
[edit]| Party | Candidate | Votes | % | |
|---|---|---|---|---|
| Democratic | Edmond M. "Ed" Fortune | 45,645 | 47.3% | |
| Republican | Tom Tobiassen | 50,791 | 52.7% | |
| Total votes | 96,436 | 100% | ||
1986
[edit]| Party | Candidate | Votes | % | |
|---|---|---|---|---|
| Democratic | Bill Rosasco | 16,514 | 37.2% | |
| Democratic | Pat Thomas | 27,904 | 62.8% | |
| Total votes | 44,418 | 100% | ||
1992
[edit]| Party | Candidate | Votes | % | |
|---|---|---|---|---|
| Democratic | Warren H. Folks | 7,688 | 20.4% | |
| Democratic | Betty S. Holzendorf | 29,975 | 79.6% | |
| Total votes | 37,663 | 100% | ||
| Party | Candidate | Votes | % | |
|---|---|---|---|---|
| Democratic | Betty S. Holzendorf | 62,117 | 60.5% | |
| Non-Partisan Association | Phillip Brown | 9,099 | 8.9% | |
| Non-Partisan Association | Sandra Darling | 31,328 | 30.5% | |
| Write-In | Romero | 44 | 0.0% | |
| Total votes | 102,588 | 100% | ||
1994
[edit]| Party | Candidate | Votes | % | |
|---|---|---|---|---|
| Democratic | Phillip Brown | 7,199 | 22.3% | |
| Democratic | Betty S. Holzendorf | 25,132 | 77.7% | |
| Total votes | 32,331 | 100% | ||
2010
[edit]| Party | Candidate | Votes | % | |
|---|---|---|---|---|
| Republican | Greg Evers | 32,455 | 71.3% | |
| Republican | Mike Hill | 13,089 | 28.7% | |
| Total votes | 45,544 | 100% | ||
| Party | Candidate | Votes | % | |
|---|---|---|---|---|
| Republican | Greg Evers | 100,073 | 79.1% | |
| Tea Party | Christopher S. Crawford | 26,148 | 20.7% | |
| Write-In | Margaret M. Smith | 310 | 0.2% | |
| Total votes | 126,531 | 100% | ||
2018
[edit]| Party | Candidate | Votes | % | |
|---|---|---|---|---|
| Republican | George B. Gainer | 149,157 | 75.3% | |
| Democratic | Mary Jeanne "Gigi" Gibson | 48,979 | 24.7% | |
| Total votes | 198,136 | 100% | ||
2022
[edit]| Party | Candidate | Votes | % | |
|---|---|---|---|---|
| Republican | Regina Piazza | 16,961 | 23.5% | |
| Republican | Jay Trumbull | 55,198 | 76.5% | |
| Total votes | 72,159 | 100% | ||
| Party | Candidate | Votes | % | |
|---|---|---|---|---|
| Republican | Jay Trumbull | 159,041 | 78.5% | |
| Democratic | Carolynn Zonia | 43,498 | 21.5% | |
| Total votes | 202,539 | 100% | ||
References
[edit]- ^ "Florida Department of State - Election Results".
- ^ "Florida Department of State - Election Results".
- ^ "Florida Department of State - Election Results".
- ^ "Florida Department of State - Election Results".
- ^ "Florida Department of State - Election Results".
- ^ "Florida Department of State - Election Results".
- ^ "Florida Department of State - Election Results".
- ^ "Florida Department of State - Election Results".
- ^ "Florida Department of State - Election Results".
- ^ "Florida Department of State - Election Results".