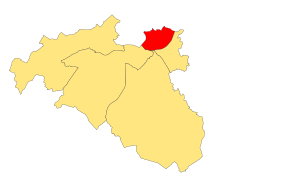
Giffnock and Thornliebank (ward)

Giffnock and Thornliebank is one of the five wards used to elect members of the East Renfrewshire Council. It elects three Councillors.
Councillors
[edit]| Election | Councillors | |||||||
|---|---|---|---|---|---|---|---|---|
| 2007 | Jim Fletcher (Labour) | Alex Mackie (Liberal Democrats) | Gordon Wallace (Conservative) | |||||
| 2012 | Vincent Waters (SNP) | |||||||
| 2017 | Colm Merrick (SNP) | |||||||
| 2022 | Mary Montague (Labour) | |||||||
Election results
[edit]2022 election
[edit]| Party | Candidate | FPv% | Count | |||||
|---|---|---|---|---|---|---|---|---|
| 1 | 2 | 3 | 4 | 5 | ||||
| SNP | Colm Merrick (incumbent) | 26.1% | 1,888 | |||||
| Conservative | Gordon Wallace (incumbent) | 25.1% | 1,816 | |||||
| Labour | Mary Montague | 22.2% | 1,608 | 1,629 | 1,630 | 1,662 | 1,863 | |
| Independent | Allan Steele | 13.5% | 978 | 983 | 986 | 998 | 1,033 | |
| Independent | Alice Roy | 6.4% | 464 | 469 | 470 | 488 | 576 | |
| Scottish Green | Karen Sharkey | 5.4% | 387 | 418 | 418 | 439 | ||
| Alba | George Gebbie | 1.3% | 92 | 97 | 97 | |||
| Electorate: 12,996 Valid: 7,233 Spoilt: 80[3] (1.1%) Quota: 1,809 Turnout: 56.2% | ||||||||
2017 election
[edit]| Party | Candidate | FPv% | Count | |||||||||
|---|---|---|---|---|---|---|---|---|---|---|---|---|
| 1 | 2 | 3 | 4 | 5 | 6 | 7 | 8 | 9 | ||||
| SNP | Colm Merrick | 24.40% | 1,853 | 1,855 | 1,860 | 1,898 | 1,990 | |||||
| Conservative | Gordon Wallace (incumbent) | 23.06% | 1,751 | 1,753 | 1,758 | 1,784 | 1,825 | 1,826 | 2,621 | |||
| Labour | Jim Fletcher (incumbent) | 18.84% | 1,431 | 1,435 | 1,438 | 1,506 | 1,615 | 1,650 | 1,715 | 1,838 | 2,224 | |
| Conservative | Paul Smith | 11.84% | 899 | 904 | 905 | 943 | 976 | 979 | ||||
| Independent | Paul Drury | 11.31% | 859 | 862 | 876 | 913 | 1,085 | 1,108 | 1,149 | 1,309 | ||
| Independent | Savio D'Souza | 6.00% | 456 | 460 | 470 | 507 | ||||||
| Liberal Democrats | Christopher Park | 3.50% | 266 | 274 | 278 | |||||||
| Independent | Gordon McCaskill * | 0.63% | 48 | 50 | ||||||||
| Scottish Libertarian | Alan Findlay | 0.42% | 32 | |||||||||
| Electorate: TBC Valid: 7,595 Spoilt: 92 Quota: 1,899 Turnout: 60.2% | ||||||||||||
2012 election
[edit]| Party | Candidate | FPv% | Count | |||
|---|---|---|---|---|---|---|
| 1 | 2 | 3 | ||||
| Labour | Jim Fletcher (incumbent) | 35.53 | 1,935 | |||
| Conservative | Gordon Wallace (incumbent) | 21.36 | 1,163 | 1,207 | 1,398 | |
| SNP | Vincent Waters | 19.89 | 1,083 | 1,209 | 1,375 | |
| Independent | Hugh Moore | 11.84 | 645 | 751 | 994 | |
| Liberal Democrats | Alex Mackie (incumbent) | 11.38 | 620 | 747 | ||
2007 election
[edit]| Party | Candidate | FPv% | Count | ||||||
|---|---|---|---|---|---|---|---|---|---|
| 1 | 2 | 3 | 4 | 5 | 6 | ||||
| Labour | Jim Fletcher | 29.8 | 2,075 | ||||||
| Conservative | Gordon Wallace | 27.2 | 1,899 | ||||||
| SNP | Joyce Lythgoe | 18.2 | 1,266 | 1,330.16 | 1,336.00 | 1,390.31 | 1,473.32 | ||
| Liberal Democrats | Alex Mackie | 17.9 | 1,244 | 1,357.28 | 1.365.41 | 1,401.65 | 1,585.21 | 2,472.07 | |
| Conservative | Gordon Wilson | 5.4 | 373 | 394.92 | 524.70 | 528.50 | |||
| Scottish Socialist | Stuart Miller | 1.6 | 112 | 132.16 | 132.32 | ||||
| Electorate: – Valid: 6,969 Spoilt: 98 Quota: 1,743 | |||||||||
References
[edit]- ^ "5th Reviews - ward maps | Scottish Boundary Commission". lgbc-scotland.gov.uk. Archived from the original on 20 March 2020. Retrieved 15 March 2020.
- ^ "Notice of poll and situation of polling stations" (PDF). East Renfrewshire Council. Retrieved 3 May 2022.
- ^ https://www.eastrenfrewshire.gov.uk/media/7645/Declaration-of-results-report/pdf/Declaration_of_results_report.pdf? [bare URL PDF]
- ^ "Local Government Election results 2017". East Renfrewshire Council. Archived from the original on 30 May 2019. Retrieved 4 February 2022.
