Tierralta

Tierralta | |
|---|---|
Municipality and town | |
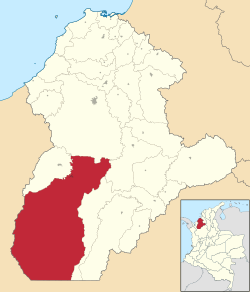
 Location of the municipality and town of Tierralta in the Córdoba Department of Colombia. | |
| Country | |
| Department | Córdoba Department |
| Area | |
| • Municipality and town | 4,938 km2 (1,907 sq mi) |
| • Urban | 7.99 km2 (3.08 sq mi) |
| Elevation | 51 m (167 ft) |
| Population (2020 est.)[1] | |
| • Municipality and town | 95,177 |
| • Density | 19/km2 (50/sq mi) |
| • Urban | 43,553 |
| • Urban density | 5,500/km2 (14,000/sq mi) |
| Time zone | UTC-5 (Colombia Standard Time) |
Tierralta is a town and municipality located in the Córdoba Department, northern Colombia.
According to 2020 estimates, the population of Tierralta was 95,177, with a population density of 19 persons per square kilometer.
Corregimientos
[edit]- Callejas
- Crucito
- Palmira
- Santa Fé de Ralito
- Caramelo
- San Clemente
- Las Claras
- Saiza
- Frasquillo
- Volador
- El Toro
- San Felipe de Cadillo
- Batata
- Tucurá
- Nueva Granada
- Santa Marta
- Villa Providencia
- Carrizola
- Urra Campo Bello
- Nuevo Oriente
Climate
[edit]| Climate data for Tierralta (Pto Nuevo), elevation 145 m (476 ft), (1971–2000) | |||||||||||||
|---|---|---|---|---|---|---|---|---|---|---|---|---|---|
| Month | Jan | Feb | Mar | Apr | May | Jun | Jul | Aug | Sep | Oct | Nov | Dec | Year |
| Mean daily maximum °C (°F) | 31.7 (89.1) | 32.3 (90.1) | 32.9 (91.2) | 32.7 (90.9) | 31.7 (89.1) | 31.4 (88.5) | 31.5 (88.7) | 31.6 (88.9) | 31.5 (88.7) | 31.3 (88.3) | 31.4 (88.5) | 31.1 (88.0) | 31.8 (89.2) |
| Daily mean °C (°F) | 26.4 (79.5) | 26.8 (80.2) | 27.4 (81.3) | 27.1 (80.8) | 26.6 (79.9) | 26.6 (79.9) | 26.5 (79.7) | 26.6 (79.9) | 26.2 (79.2) | 26.2 (79.2) | 26.2 (79.2) | 26.2 (79.2) | 26.6 (79.9) |
| Mean daily minimum °C (°F) | 22.1 (71.8) | 22.5 (72.5) | 22.7 (72.9) | 23.3 (73.9) | 23.0 (73.4) | 23.0 (73.4) | 22.7 (72.9) | 22.7 (72.9) | 22.6 (72.7) | 22.6 (72.7) | 22.5 (72.5) | 22.6 (72.7) | 22.7 (72.9) |
| Average precipitation mm (inches) | 56.9 (2.24) | 70.7 (2.78) | 46.9 (1.85) | 154.1 (6.07) | 267.1 (10.52) | 237.8 (9.36) | 228.1 (8.98) | 246.5 (9.70) | 179.3 (7.06) | 234.7 (9.24) | 149.1 (5.87) | 98.6 (3.88) | 1,969.8 (77.55) |
| Average precipitation days | 9 | 9 | 8 | 15 | 21 | 20 | 19 | 21 | 18 | 19 | 16 | 13 | 189 |
| Average relative humidity (%) | 82 | 80 | 78 | 80 | 85 | 86 | 85 | 85 | 85 | 85 | 85 | 85 | 83 |
| Source: Instituto de Hidrologia Meteorologia y Estudios Ambientales[2] | |||||||||||||
References
[edit]- ^ Citypopulation.de Population of Tierralta municipality
- ^ "Promedios Climatológicos 1971–2000" (in Spanish). Instituto de Hidrologia Meteorologia y Estudios Ambientales. Retrieved 25 June 2024.[dead link]
- (in Spanish) Gobernacion de Cordoba - Tierralta[permanent dead link]
- (in Spanish) Tierralta official website
