Файл:Halflife-sim.gif

Halflife-sim.gif (100 × 188 пкс, размер файла: 17 КБ, MIME-тип: image/gif, закольцованный, 80 фреймов, 8,5 с)

Краткое описание

Описание
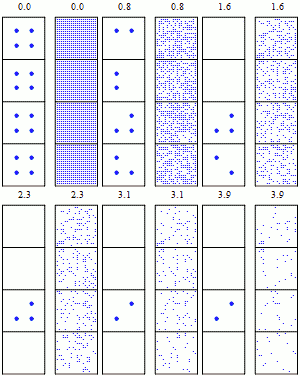
English: Simulation of many identical atoms undergoing radioactive decay, starting with either four atoms (left) or 400 atoms (right). The number at the top indicates how many half-lives have elapsed. Note the law of large numbers: With more atoms, the overall decay is less random. Image made with Mathematica, I am happy to send the source code if you would like to make this image more beautiful, or for any other reason.
Дата
Источник Собственная работа
Автор Sbyrnes321

Лицензирование

Public domain Я, владелец авторских прав на это произведение, передаю его в общественное достояние. Это разрешение действует по всему миру.
В некоторых странах это не может быть возможно юридически, в таком случае:
Я даю право кому угодно использовать данное произведение в любых целях без каких-либо условий, за исключением таких условий, которые требуются по закону.
(* Source code written in Mathematica 6.0, by Steve Byrnes, 2010. I release this code into the public domain. *)  SeedRandom[2]  (*Build list of point coordinates and radii*)  BuildCoordList[SqCenterX_, SqCenterY_, SqSide_, PtsPerRow_] :=    Flatten[Table[{i, j}, {i, SqCenterX - SqSide/2, SqCenterX + SqSide/2, SqSide/(PtsPerRow - 1)},      {j, SqCenterY - SqSide/2, SqCenterY + SqSide/2, SqSide/(PtsPerRow - 1)}], 1];  coordslist = Join[    BuildCoordList[3.5, 1, 1.8, 20],    BuildCoordList[3.5, 3, 1.8, 20],    BuildCoordList[3.5, 5, 1.8, 20],    BuildCoordList[3.5, 7, 1.8, 20],    BuildCoordList[1, 1, .7, 2],    BuildCoordList[1, 3, .7, 2],    BuildCoordList[1, 5, .7, 2],    BuildCoordList[1, 7, .7, 2]]; NumPts = Length[coordslist]; radiuslist = Join[Table[.03, {i, 1, 4*400}], Table[.1, {i, 1, 4*4}]];  (*Draw borders*)  xlist = {0, 2}; leftx = 0; rightx = 2; numx = Length[xlist]; ylist = {0, 2, 4, 6, 8}; topy = 0; boty = 8; numy = Length[ylist]; lines = {}; For[i = 1, i <= numy, i++,    lines = Append[lines, Line[{{leftx, ylist[[i]]}, {rightx, ylist[[i]]}}]]]; For[i = 1, i <= numx, i++,    lines = Append[lines, Line[{{xlist[[i]], topy}, {xlist[[i]], boty}}]]];  xlist = {2.5, 4.5}; leftx = 2.5; rightx = 4.5; numx = Length[xlist]; ylist = {0, 2, 4, 6, 8}; topy = 0; boty = 8; numy = Length[ylist]; For[i = 1, i <= numy, i++,    lines = Append[lines, Line[{{leftx, ylist[[i]]}, {rightx, ylist[[i]]}}]]]; For[i = 1, i <= numx, i++,    lines = Append[lines, Line[{{xlist[[i]], topy}, {xlist[[i]], boty}}]]];  (*Write numbers: I want to be able to write a number with one decimal place, including padding with ".0" when it's an integer.*)  WriteNum[num_] := Block[{rounded}, rounded = N[Floor[num, 0.1]];     If[FractionalPart[rounded] == 0, ToString[rounded] <> "0", ToString[rounded]]];  (*Randomly choose decay times: To get an expontial-decay-distributed random number, we pick a number uniformly between 0 and 1. Take its negative log to get the time that it blows up, which is between 0 and infinity. But divide by log 2 so that when the time = 1, there's 50% chance of decaying. *)  BlowTime = Table[-Log[RandomReal[]]/Log[2], {i, 1, NumPts}];  (*Draw graphics*)  GraphicsList = {}; NumFrames = 80; TimePerFrame = .05;  Video = {}; For[frame = 1, frame <= NumFrames, frame++,   CurrentTime = (frame - 1)*TimePerFrame;   ImageGraphicsList = lines;   ImageGraphicsList =     Append[ImageGraphicsList, Text[WriteNum[CurrentTime], {.8, 8.5}, {-1, 0}]];   ImageGraphicsList =     Append[ImageGraphicsList, Text[WriteNum[CurrentTime], {3.3, 8.5}, {-1, 0}]];   For[pt = 1, pt <= NumPts, pt++,    If[CurrentTime < BlowTime[[pt]],      ImageGraphicsList =   Append[ImageGraphicsList, {Blue, Disk[coordslist[[pt]], radiuslist[[pt]]]}]]];   Video = Append[Video, Graphics[ImageGraphicsList, ImageSize -> 100]];];  (*Pause at start*) Video = Join[Table[Video[[1]], {i, 1, 5}], Video];  (*Export*) Export["test.gif", Video, "DisplayDurations" -> {10}, "AnimationRepititions" -> Infinity ] 

Краткие подписи

Добавьте однострочное описание того, что собой представляет этот файл

Элементы, изображённые на этом файле

изображённый объект

У этого свойства есть некоторое значение без элемента в

История файла

Нажмите на дату/время, чтобы посмотреть файл, который был загружен в тот момент.

Дата/времяМиниатюраРазмерыУчастникПримечание
текущий19:41, 25 марта 2010Миниатюра для версии от 19:41, 25 марта 2010100 × 188 (17 КБ)AiyizoOptimized animation, converted to 16 color mode
06:35, 5 февраля 2010Миниатюра для версии от 06:35, 5 февраля 2010100 × 188 (156 КБ)Sbyrnes321Changed top-bottom split to left-right split, with space between; pause at start; 400 atoms in each crowded box instead of 296. (Thanks to Bdb484 for suggestions.)
00:26, 29 января 2010Миниатюра для версии от 00:26, 29 января 201061 × 131 (75 КБ)Sbyrnes321{{Information |Description={{en|1=Simulation of many identical atoms undergoing radioactive decay. The number at the top indicates how many half-lives have elapsed. Note that after one half-life there are not ''exactly'' one-half of the atoms remaining, o

Глобальное использование файла

Данный файл используется в следующих вики: