1928 United States presidential election in Colorado
 From Wikipedia the free encyclopedia
| ||||||||||||||||||||||||||
| ||||||||||||||||||||||||||
 County Results
| ||||||||||||||||||||||||||
| ||||||||||||||||||||||||||
| Elections in Colorado |
|---|
 |
The 1928 United States presidential election in Colorado took place on November 6, 1928, as part of the 1928 United States presidential election which was held throughout all contemporary forty-eight states. Voters chose six representatives, or electors to the Electoral College, who voted for president and vice president.
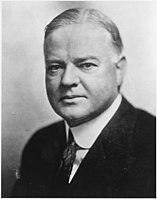
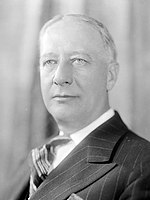
Although Colorado had been strongly Democratic-leaning between 1896 and 1916, the nomination of Catholic New York Governor Smith was very poorly received in the eastern part of the state, part of the High Plains Methodist “Bible Belt”. The state had been all but ruled by the Ku Klux Klan for a number of years early in the decade,[1] and the strong anti-Catholic sentiment remained outside the heavily Mexican-American south-central part of the state.[2] Although Smith did make large gains in the Mexican-American counties, Hoover gained greatly over Calvin Coolidge in 1924 by up to 30 percent in the heavily populated Front Range counties and Colorado consequently became the seventh most Republican state in the nation, voting 14 percentage points more Republican than the nation at-large.
Hoover’s is the best Republican presidential performance in Colorado’s history,[3] and the second-best by any candidate behind William Jennings Bryan in 1896 when he was overwhelmingly supported by the state’s powerful silver mining industry.[4]
Results[edit]
| Presidential Candidate | Running Mate | Party | Electoral Vote (EV) | Popular Vote (PV) | |
|---|---|---|---|---|---|
| Herbert Hoover of California | Charles Curtis | Republican | 6[5] | 253,872 | 64.72% |
| Alfred E. Smith | Joseph T. Robinson | Democratic | 0 | 156,319 | 33.94% |
| Norman Thomas | James Maurer | Socialist | 0 | 3,472 | 0.89% |
| Frank E. Webb | Will Vereen | Farmer-Labor | 0 | 1,092 | 0.28% |
| William Z. Foster | Benjamin Gitlow | Workers Communist | 0 | 675 | 0.17% |
Results by county[edit]
| County | Herbert Clark Hoover[6] Republican | Alfred Emmanuel Smith[6] Democratic | Norman Mattoon Thomas[6] Socialist | Frank E. Webb[6] Farmer-Labor | William Z. Foster[6] Communist | Margin | ||||||
|---|---|---|---|---|---|---|---|---|---|---|---|---|
| % | # | % | # | % | # | % | # | % | # | % | # | |
| Baca | 78.48% | 2,108 | 19.51% | 524 | 1.56% | 42 | 0.30% | 8 | 0.15% | 4 | 58.97% | 1,584 |
| Morgan | 76.10% | 4,197 | 22.52% | 1,242 | 1.03% | 57 | 0.18% | 10 | 0.16% | 9 | 53.58% | 2,955 |
| El Paso | 75.28% | 16,243 | 23.49% | 5,069 | 1.05% | 227 | 0.13% | 29 | 0.05% | 10 | 51.78% | 11,174 |
| Otero | 74.88% | 5,788 | 24.27% | 1,876 | 0.52% | 40 | 0.25% | 19 | 0.09% | 7 | 50.61% | 3,912 |
| Logan | 71.92% | 4,377 | 26.62% | 1,620 | 0.72% | 44 | 0.58% | 35 | 0.16% | 10 | 45.30% | 2,757 |
| Bent | 72.13% | 1,957 | 27.31% | 741 | 0.29% | 8 | 0.18% | 5 | 0.07% | 2 | 44.82% | 1,216 |
| Prowers | 71.50% | 3,228 | 26.93% | 1,216 | 0.84% | 38 | 0.55% | 25 | 0.18% | 8 | 44.56% | 2,012 |
| Elbert | 71.38% | 1,933 | 27.25% | 738 | 0.89% | 24 | 0.41% | 11 | 0.07% | 2 | 44.13% | 1,195 |
| Larimer | 70.94% | 8,213 | 27.66% | 3,203 | 0.86% | 100 | 0.40% | 46 | 0.14% | 16 | 43.27% | 5,010 |
| Washington | 69.99% | 2,132 | 27.94% | 851 | 1.25% | 38 | 0.66% | 20 | 0.16% | 5 | 42.06% | 1,281 |
| Arapahoe | 70.29% | 6,086 | 28.44% | 2,463 | 0.80% | 69 | 0.38% | 33 | 0.09% | 8 | 41.84% | 3,623 |
| Yuma | 69.07% | 3,401 | 28.09% | 1,383 | 1.87% | 92 | 0.81% | 40 | 0.16% | 8 | 40.98% | 2,018 |
| Weld | 69.58% | 13,719 | 29.22% | 5,762 | 0.62% | 123 | 0.44% | 87 | 0.13% | 26 | 40.36% | 7,957 |
| Lincoln | 69.11% | 2,110 | 29.09% | 888 | 0.85% | 26 | 0.92% | 28 | 0.03% | 1 | 40.03% | 1,222 |
| Jefferson | 69.09% | 6,754 | 29.46% | 2,880 | 0.99% | 97 | 0.32% | 31 | 0.13% | 13 | 39.63% | 3,874 |
| Fremont | 68.79% | 5,365 | 30.16% | 2,352 | 0.83% | 65 | 0.17% | 13 | 0.05% | 4 | 38.63% | 3,013 |
| Kiowa | 67.59% | 1,024 | 30.23% | 458 | 1.12% | 17 | 0.99% | 15 | 0.07% | 1 | 37.36% | 566 |
| Delta | 67.32% | 3,731 | 30.17% | 1,672 | 1.61% | 89 | 0.72% | 40 | 0.18% | 10 | 37.15% | 2,059 |
| Montrose | 67.27% | 2,873 | 30.37% | 1,297 | 1.50% | 64 | 0.73% | 31 | 0.14% | 6 | 36.90% | 1,576 |
| Kit Carson | 67.37% | 2,486 | 30.81% | 1,137 | 1.03% | 38 | 0.70% | 26 | 0.08% | 3 | 36.56% | 1,349 |
| Boulder | 67.48% | 9,457 | 31.13% | 4,363 | 0.92% | 129 | 0.28% | 39 | 0.19% | 27 | 36.35% | 5,094 |
| Sedgwick | 67.51% | 1,247 | 31.40% | 580 | 0.81% | 15 | 0.22% | 4 | 0.05% | 1 | 36.11% | 667 |
| Phillips | 65.16% | 1,440 | 31.90% | 705 | 2.49% | 55 | 0.45% | 10 | 0.00% | 0 | 33.26% | 735 |
| Mesa | 65.76% | 6,446 | 32.88% | 3,223 | 0.92% | 90 | 0.36% | 35 | 0.08% | 8 | 32.88% | 3,223 |
| Rio Blanco | 65.50% | 860 | 32.67% | 429 | 1.45% | 19 | 0.15% | 2 | 0.23% | 3 | 32.83% | 431 |
| Pueblo | 65.65% | 15,541 | 33.29% | 7,881 | 0.74% | 174 | 0.20% | 47 | 0.13% | 30 | 32.36% | 7,660 |
| Crowley | 65.42% | 1,243 | 33.42% | 635 | 0.63% | 12 | 0.53% | 10 | 0.00% | 0 | 32.00% | 608 |
| Moffat | 64.56% | 1,346 | 34.05% | 710 | 0.96% | 20 | 0.34% | 7 | 0.10% | 2 | 30.50% | 636 |
| Cheyenne | 63.85% | 945 | 33.78% | 500 | 1.55% | 23 | 0.81% | 12 | 0.00% | 0 | 30.07% | 445 |
| Douglas | 64.25% | 1,107 | 35.00% | 603 | 0.58% | 10 | 0.17% | 3 | 0.00% | 0 | 29.25% | 504 |
| Rio Grande | 64.03% | 2,254 | 34.83% | 1,226 | 0.60% | 21 | 0.37% | 13 | 0.17% | 6 | 29.20% | 1,028 |
| Denver | 63.40% | 73,543 | 35.55% | 41,238 | 0.63% | 736 | 0.13% | 150 | 0.29% | 335 | 27.85% | 32,305 |
| Eagle | 63.18% | 1,014 | 35.51% | 570 | 0.75% | 12 | 0.37% | 6 | 0.19% | 3 | 27.66% | 444 |
| Adams | 63.10% | 4,031 | 35.46% | 2,265 | 0.85% | 54 | 0.49% | 31 | 0.11% | 7 | 27.65% | 1,766 |
| Park | 62.82% | 740 | 35.57% | 419 | 1.10% | 13 | 0.42% | 5 | 0.08% | 1 | 27.25% | 321 |
| Saguache | 62.62% | 1,491 | 35.87% | 854 | 1.18% | 28 | 0.17% | 4 | 0.17% | 4 | 26.75% | 637 |
| Montezuma | 62.37% | 1,341 | 35.91% | 772 | 1.30% | 28 | 0.42% | 9 | 0.00% | 0 | 26.47% | 569 |
| Grand | 62.15% | 770 | 36.40% | 451 | 1.29% | 16 | 0.08% | 1 | 0.08% | 1 | 25.75% | 319 |
| Clear Creek | 61.05% | 790 | 37.17% | 481 | 1.55% | 20 | 0.23% | 3 | 0.00% | 0 | 23.88% | 309 |
| Jackson | 60.21% | 401 | 37.39% | 249 | 1.50% | 10 | 0.45% | 3 | 0.45% | 3 | 22.82% | 152 |
| Garfield | 60.03% | 2,435 | 38.51% | 1,562 | 0.94% | 38 | 0.42% | 17 | 0.10% | 4 | 21.52% | 873 |
| Custer | 58.88% | 600 | 38.17% | 389 | 2.45% | 25 | 0.29% | 3 | 0.20% | 2 | 20.71% | 211 |
| Chaffee | 59.49% | 1,880 | 38.92% | 1,230 | 1.17% | 37 | 0.22% | 7 | 0.19% | 6 | 20.57% | 650 |
| La Plata | 59.58% | 2,837 | 39.31% | 1,872 | 0.84% | 40 | 0.17% | 8 | 0.10% | 5 | 20.26% | 965 |
| Alamosa | 58.23% | 1,759 | 41.01% | 1,239 | 0.50% | 15 | 0.23% | 7 | 0.03% | 1 | 17.21% | 520 |
| Routt | 57.36% | 2,304 | 40.95% | 1,645 | 1.17% | 47 | 0.32% | 13 | 0.20% | 8 | 16.41% | 659 |
| Dolores | 55.92% | 387 | 40.17% | 278 | 3.18% | 22 | 0.29% | 2 | 0.43% | 3 | 15.75% | 109 |
| Archuleta | 56.48% | 610 | 41.39% | 447 | 1.57% | 17 | 0.56% | 6 | 0.00% | 0 | 15.09% | 163 |
| San Miguel | 54.91% | 721 | 42.19% | 554 | 1.29% | 17 | 0.38% | 5 | 1.22% | 16 | 12.72% | 167 |
| Gunnison | 55.21% | 1,456 | 43.04% | 1,135 | 1.25% | 33 | 0.30% | 8 | 0.19% | 5 | 12.17% | 321 |
| Gilpin | 55.17% | 299 | 43.54% | 236 | 1.11% | 6 | 0.18% | 1 | 0.00% | 0 | 11.62% | 63 |
| Hinsdale | 53.78% | 128 | 44.54% | 106 | 1.68% | 4 | 0.00% | 0 | 0.00% | 0 | 9.24% | 22 |
| Summit | 53.16% | 362 | 44.93% | 306 | 1.76% | 12 | 0.15% | 1 | 0.00% | 0 | 8.22% | 56 |
| Teller | 52.04% | 1,184 | 45.58% | 1,037 | 1.80% | 41 | 0.31% | 7 | 0.26% | 6 | 6.46% | 147 |
| Ouray | 51.49% | 535 | 46.10% | 479 | 1.54% | 16 | 0.87% | 9 | 0.00% | 0 | 5.39% | 56 |
| Pitkin | 50.95% | 485 | 47.69% | 454 | 0.95% | 9 | 0.42% | 4 | 0.00% | 0 | 3.26% | 31 |
| Huerfano | 49.15% | 3,260 | 50.40% | 3,343 | 0.30% | 20 | 0.09% | 6 | 0.06% | 4 | -1.25% | -83 |
| Conejos | 45.24% | 1,463 | 52.32% | 1,692 | 1.76% | 57 | 0.34% | 11 | 0.34% | 11 | -7.08% | -229 |
| Las Animas | 44.74% | 5,367 | 53.85% | 6,459 | 1.24% | 149 | 0.10% | 12 | 0.07% | 8 | -9.10% | -1,092 |
| Mineral | 41.14% | 144 | 53.43% | 187 | 5.43% | 19 | 0.00% | 0 | 0.00% | 0 | -12.29% | -43 |
| Lake | 40.10% | 990 | 58.69% | 1,449 | 0.93% | 23 | 0.04% | 1 | 0.24% | 6 | -18.59% | -459 |
| San Juan | 37.13% | 277 | 58.45% | 436 | 3.62% | 27 | 0.40% | 3 | 0.40% | 3 | -21.31% | -159 |
| Costilla | 37.33% | 657 | 60.80% | 1,070 | 0.85% | 15 | 0.91% | 16 | 0.11% | 2 | -23.47% | -413 |
References[edit]
- ^ Ubbelohde, Carl; Benson, Maxine and Smith Duane A.; A Colorado History, p. 286 ISBN 0871089424
- ^ Menendez, Albert J.; The Religious Factor in the 1960 Presidential Election. An Analysis of the Kennedy Victory Over Anti-Catholic Prejudice, p. 175 ISBN 0786460377
- ^ "Presidential General Election Results Comparison – Colorado". Dave Leip's U.S. Election Atlas.
- ^ Phillips, Kevin P.; The Emerging Republican Majority, p. 458 ISBN 9780691163246
- ^ "1928 Presidential General Election Results – Colorado". Dave Leip’s U.S. Election Atlas. Retrieved October 25, 2019.
- ^ a b c d e Our Campaigns; CO US President Race, November 06, 1928


