2002 United States Senate elections
 From Wikipedia the free encyclopedia
| ||||||||||||||||||||||||||||||||||||||||||||||||||||||||||||||||||||
34 of the 100 seats in the United States Senate 51 seats needed for a majority | ||||||||||||||||||||||||||||||||||||||||||||||||||||||||||||||||||||
|---|---|---|---|---|---|---|---|---|---|---|---|---|---|---|---|---|---|---|---|---|---|---|---|---|---|---|---|---|---|---|---|---|---|---|---|---|---|---|---|---|---|---|---|---|---|---|---|---|---|---|---|---|---|---|---|---|---|---|---|---|---|---|---|---|---|---|---|---|
| ||||||||||||||||||||||||||||||||||||||||||||||||||||||||||||||||||||
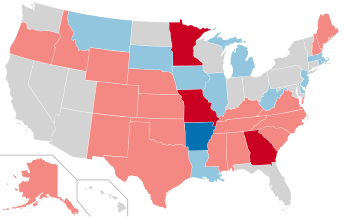 Results of the elections: Democratic gain Democratic hold Republican gain Republican hold No election | ||||||||||||||||||||||||||||||||||||||||||||||||||||||||||||||||||||
| ||||||||||||||||||||||||||||||||||||||||||||||||||||||||||||||||||||
.jpg)
.jpg)
The 2002 United States Senate elections featured a series of fiercely contested elections that resulted in a victory for the Republican Party, which gained two seats and thus a narrow majority from the Democratic Party in the United States Senate. The Senate seats up for election, known as class 2 Senate seats, were last up for regular election in 1996. The election cycle was held on November 5, 2002, almost fourteen months after the September 11, 2001 attacks.
Going into the election, Democrats had a 51–49 majority due to an independent that caucused with them, however, this was reduced to a 50–49–1 plurality following the death of Democrat Paul Wellstone and the appointment of a member of the Independence Party of Minnesota in his place. The Democrats had originally hoped to do well, as the party holding the presidency historically loses seats in midterm elections, and additionally, the Republicans had 20 seats up for election compared to 14 Democratic seats up for election. In addition, the Republicans had five open seats, while the Democrats and the Independence Party of Minnesota had one each. However, the Republicans were able to hold their five open seats and pick up the one that was held by the IPM, while the Democrats held their only open seat. Republicans also defeated two Democratic incumbents, while Democrats defeated one Republican incumbent. Together with gains made in the House of Representatives, this election was one of three mid-term elections in which the party in control of the White House did not lose Congressional seats (the others were 1934 and 1998).
Trent Lott led the Senate Republicans through this election cycle and was due to become the new Senate Majority Leader upon the retaking of control of the Senate by the Republicans. However, his controversial praise for Strom Thurmond's 1948 segregationist Dixiecrat presidential campaign at Thurmond's 100th birthday celebration led to Lott's stepping-down from Senate leadership, and resulted in Tennessee Republican Bill Frist being selected as the new Senate Majority Leader instead.
This was the only election cycle ever where the party of the incumbent president gained new control of a house of Congress in a midterm election. This is also the last midterm election cycle where the party controlling the White House flipped a senate seat in a state they did not win in the preceding presidential election (in this case, Minnesota). As of 2023[update], this was the last Senate election cycle where Republicans won Senate elections in Minnesota, New Mexico, Oregon, and Virginia.
Results summary[edit]
| 48 | 1 | 51 |
| Democratic | Independent | Republican |
| Parties | Total | ||||||||||||||||||||||||||||||||||||||||||||||||||||||||||||||||||||||||||||||||||||||||||||||||||
|---|---|---|---|---|---|---|---|---|---|---|---|---|---|---|---|---|---|---|---|---|---|---|---|---|---|---|---|---|---|---|---|---|---|---|---|---|---|---|---|---|---|---|---|---|---|---|---|---|---|---|---|---|---|---|---|---|---|---|---|---|---|---|---|---|---|---|---|---|---|---|---|---|---|---|---|---|---|---|---|---|---|---|---|---|---|---|---|---|---|---|---|---|---|---|---|---|---|---|---|
| Democratic | Republican | Independent | Independence | Others | |||||||||||||||||||||||||||||||||||||||||||||||||||||||||||||||||||||||||||||||||||||||||||||||
| Last elections (2000) | 50 | 50 | 0 | 0 | 0 | 100 | |||||||||||||||||||||||||||||||||||||||||||||||||||||||||||||||||||||||||||||||||||||||||||||
| Before these elections | 49 | 49 | 1 | 1 | 0 | 100 | |||||||||||||||||||||||||||||||||||||||||||||||||||||||||||||||||||||||||||||||||||||||||||||
| Not up | 36 | 29 | 1 | 0 | — | 66 | |||||||||||||||||||||||||||||||||||||||||||||||||||||||||||||||||||||||||||||||||||||||||||||
| Up | 13 | 20 | 0 | 1 | — | 34 | |||||||||||||||||||||||||||||||||||||||||||||||||||||||||||||||||||||||||||||||||||||||||||||
| Class 2 (1996→2002) | 12 | 20 | — | 1 | — | 33 | |||||||||||||||||||||||||||||||||||||||||||||||||||||||||||||||||||||||||||||||||||||||||||||
| Special: Class 1 | 1 | 0 | — | — | — | 1 | |||||||||||||||||||||||||||||||||||||||||||||||||||||||||||||||||||||||||||||||||||||||||||||
| Incumbent retired | 0 | 4 | — | 1 | — | 5 | |||||||||||||||||||||||||||||||||||||||||||||||||||||||||||||||||||||||||||||||||||||||||||||
| Held by same party | 0 | 4 | — | 0 | — | 4 | |||||||||||||||||||||||||||||||||||||||||||||||||||||||||||||||||||||||||||||||||||||||||||||
| Replaced by other party | — | 1 | |||||||||||||||||||||||||||||||||||||||||||||||||||||||||||||||||||||||||||||||||||||||||||||||||
| Result | 0 | 5 | 0 | 0 | 0 | 5 | |||||||||||||||||||||||||||||||||||||||||||||||||||||||||||||||||||||||||||||||||||||||||||||
| Regular elections | |||||||||||||||||||||||||||||||||||||||||||||||||||||||||||||||||||||||||||||||||||||||||||||||||||
| Incumbent ran | 12[c] | 16[d] | — | 0 | — | 28 | |||||||||||||||||||||||||||||||||||||||||||||||||||||||||||||||||||||||||||||||||||||||||||||
| Won re-election | 10 | 14 | — | 0 | — | 24 | |||||||||||||||||||||||||||||||||||||||||||||||||||||||||||||||||||||||||||||||||||||||||||||
| Lost re-election | — | — | — | 2 | |||||||||||||||||||||||||||||||||||||||||||||||||||||||||||||||||||||||||||||||||||||||||||||||
| Lost or withdrew renomination but held by same party | 1 | 1 | — | — | — | 2 | |||||||||||||||||||||||||||||||||||||||||||||||||||||||||||||||||||||||||||||||||||||||||||||
| Result | 12 | 16 | 0 | 0 | 0 | 28 | |||||||||||||||||||||||||||||||||||||||||||||||||||||||||||||||||||||||||||||||||||||||||||||
| Special election | |||||||||||||||||||||||||||||||||||||||||||||||||||||||||||||||||||||||||||||||||||||||||||||||||||
| Appointee ran | 1 | 0 | — | 0 | — | 1 | |||||||||||||||||||||||||||||||||||||||||||||||||||||||||||||||||||||||||||||||||||||||||||||
| Won election | 0 | — | — | 0 | — | 0 | |||||||||||||||||||||||||||||||||||||||||||||||||||||||||||||||||||||||||||||||||||||||||||||
| Lost election | — | — | — | 1 | |||||||||||||||||||||||||||||||||||||||||||||||||||||||||||||||||||||||||||||||||||||||||||||||
| Result | 0 | 1 | 0 | 0 | 0 | 1 | |||||||||||||||||||||||||||||||||||||||||||||||||||||||||||||||||||||||||||||||||||||||||||||
| Total elected | 12 | 22 | 0 | 0 | 0 | 34 | |||||||||||||||||||||||||||||||||||||||||||||||||||||||||||||||||||||||||||||||||||||||||||||
| Net change | 2 | ||||||||||||||||||||||||||||||||||||||||||||||||||||||||||||||||||||||||||||||||||||||||||||||||||
| Nationwide vote | 19,873,164 | 21,566,016 | 343,625 | 45,139/51,863[a] | 1,413,653 / 1,406,929[a] | 43,241,597 | |||||||||||||||||||||||||||||||||||||||||||||||||||||||||||||||||||||||||||||||||||||||||||||
| Share | 45.96% | 49.87% | 0.79% | 0.10 / 0.12% | 3.27 / 3.25% | 100% | |||||||||||||||||||||||||||||||||||||||||||||||||||||||||||||||||||||||||||||||||||||||||||||
| Result | 48 | 51 | 1 | 0 | 0 | 100 | |||||||||||||||||||||||||||||||||||||||||||||||||||||||||||||||||||||||||||||||||||||||||||||
Source: Clerk of the U.S. House of Representatives[1]
Change in composition[edit]
Before the elections[edit]
After the death of Paul Wellstone on October 25, 2002, and the appointment of Minnesota on November 4.
| D1 | D2 | D3 | D4 | D5 | D6 | D7 | D8 | D9 | D10 |
| D20 | D19 | D18 | D17 | D16 | D15 | D14 | D13 | D12 | D11 |
| D21 | D22 | D23 | D24 | D25 | D26 | D27 | D28 | D29 | D30 |
| D40 Iowa Ran | D39 Ill. Ran | D38 Ga. Ran | D37 Del. Ran | D36 | D35 | D34 | D33 | D32 | D31 |
| D41 La. Ran | D42 Mass. Ran | D43 Mich. Ran | R44 Mo. (sp) Ran | D45 Mont. Ran | D46 N.J. Withdrew | D47 R.I. Ran | D48 S.D. Ran | D49 W.Va. Ran | I1 |
| ↑ Plurality with Independent in caucus | |||||||||
| R41 N.M. Ran | R42 N.C. Retired | R43 Okla. Ran | R44 Ore. Ran | R45 S.C. Retired | R46 Tenn. Retired | R47 Texas Retired | R48 Va. Ran | R49 Wyo. Ran | IPM1[e] Minn. Retired[f] |
| R40 N.H. Ran | R39 Neb. Ran | R38 Miss. Ran | R37 Me. Ran | R36 Ky. Ran | R35 Kan. Ran | R34 Idaho Ran | R33 Colo. Ran | R32 Ark. Ran | R31 Alaska Ran |
| R21 | R22 | R23 | R24 | R25 | R26 | R27 | R28 | R29 | R30 Ala. Ran |
| R20 | R19 | R18 | R17 | R16 | R15 | R14 | R13 | R12 | R11 |
| R1 | R2 | R3 | R4 | R5 | R6 | R7 | R8 | R9 | R10 |
After the elections[edit]
| D1 | D2 | D3 | D4 | D5 | D6 | D7 | D8 | D9 | D10 |
| D20 | D19 | D18 | D17 | D16 | D15 | D14 | D13 | D12 | D11 |
| D21 | D22 | D23 | D24 | D25 | D26 | D27 | D28 | D29 | D30 |
| D40 La. Re-elected | D39 Iowa Re-elected | D38 Ill. Re-elected | D37 Del. Re-elected | D36 | D35 | D34 | D33 | D32 | D31 |
| D41 Mass. Re-elected | D42 Mich. Re-elected | D43 Mont. Re-elected | D44 N.J. Hold | D45 R.I. Re-elected | D46 S.D. Re-elected | D47 W.Va. Re-elected | D48 Ark. Gain | I1 | R51 Mo. (sp) Gain[g] |
| Majority → | |||||||||
| R41 N.C. Hold | R42 Okla. Re-elected | R43 Ore. Re-elected | R44 S.C. Hold | R45 Tenn. Hold | R46 Texas Hold | R47 Va. Re-elected | R48 Wyo. Re-elected | R49 Ga. Gain | R50 Minn. Gain |
| R40 N.M. Re-elected | R39 N.H. Hold | R38 Neb. Re-elected | R37 Miss. Re-elected | R36 Me. Re-elected | R35 Ky. Re-elected | R34 Kan. Re-elected | R33 Idaho Re-elected | R32 Colo. Re-elected | R31 Alaska Re-elected |
| R21 | R22 | R23 | R24 | R25 | R26 | R27 | R28 | R29 | R30 Ala. Re-elected |
| R20 | R19 | R18 | R17 | R16 | R15 | R14 | R13 | R12 | R11 |
| R1 | R2 | R3 | R4 | R5 | R6 | R7 | R8 | R9 | R10 |
| Key: |
|
|---|
Gains, losses and holds[edit]
Retirements[edit]
One Independence and four Republicans retired instead of seeking re-election.
| State | Senator | Replaced by | Ref |
|---|---|---|---|
| Minnesota | Dean Barkley | Norm Coleman | [2] |
| North Carolina | Jesse Helms | Elizabeth Dole | [3] |
| South Carolina | Strom Thurmond | Lindsey Graham | [4] |
| Tennessee | Fred Thompson | Lamar Alexander | [5] |
| Texas | Phil Gramm | John Cornyn | [6] |
Nomination withdrawn[edit]
One Democrat was originally sought to run re-election but withdrew.
| State | Senator | Replaced by | Ref |
|---|---|---|---|
| New Jersey | Robert Torricelli | Frank Lautenberg | [7] |
Defeats[edit]
Two Democrats and two Republicans sought re-election but lost in the primary or general election.
| State | Senator | Replaced by | Ref |
|---|---|---|---|
| Arkansas | Tim Hutchinson | Mark Pryor | [8] |
| Georgia | Max Cleland | Saxby Chambliss | [9] |
| Missouri (special) | Jean Carnahan | Jim Talent | [10] |
| New Hampshire | Bob Smith | John E. Sununu | [11] |
Post-election changes[edit]
One Republican resigned on December 2, 2002, and was replaced by a Republican appointee.
| State | Senator | Replaced by |
|---|---|---|
| Alaska (Class 3) | Frank Murkowski | Lisa Murkowski |
Final pre-election predictions[edit]
Several sites and individuals published predictions of competitive seats. These predictions looked at factors such as the strength of the incumbent (if the incumbent was running for re-election) and the other candidates, and the state's partisan lean (reflected in part by the state's Cook Partisan Voting Index rating). The predictions assigned ratings to each seat, indicating the predicted advantage that a party had in winning that seat. Most election predictors used:
- "tossup": no advantage
- "tilt" (used by some predictors): advantage that is not quite as strong as "lean"
- "lean": slight advantage
- "likely": significant, but surmountable, advantage
- "safe" or "solid": near-certain chance of victory
| Constituency | Incumbent | 2002 election ratings | |||||||||||
|---|---|---|---|---|---|---|---|---|---|---|---|---|---|
| State | Senator | Last election[h] | Sabato's Crystal Ball[12] | Result | |||||||||
| Alabama | Jeff Sessions | 52.5% R | Safe R | Sessions (58.6%) | |||||||||
| Alaska | Ted Stevens | 76.7% R | Safe R | Stevens (78.2%) | |||||||||
| Arkansas | Tim Hutchinson | 52.7% R | Lean D (flip) | Pryor (53.9%) (flip) | |||||||||
| Colorado | Wayne Allard | 51.4% R | Lean R | Allard (50.7%) | |||||||||
| Delaware | Joe Biden | 60.0% D | Safe D | Biden (58.2%) | |||||||||
| Georgia | Max Cleland | 48.9% D | Lean D | Chambliss (52.8%) (flip) | |||||||||
| Idaho | Larry Craig | 57.0% R | Safe R | Craig (65.2%) | |||||||||
| Illinois | Dick Durbin | 56.0% D | Safe D | Durbin (60.3%) | |||||||||
| Iowa | Tom Harkin | 51.8% D | Safe D | Harkin (54.2%) | |||||||||
| Kansas | Pat Roberts | 62.0% R | Safe R | Roberts (82.5%) | |||||||||
| Kentucky | Mitch McConnell | 55.5% R | Safe R | McConnell (64.7%) | |||||||||
| Louisiana | Mary Landrieu | 50.2% D | Lean D | Landrieu (51.7%) | |||||||||
| Maine | Susan Collins | 49.2% R | Likely R | Collins (58.4%) | |||||||||
| Massachusetts | John Kerry | 52.7% D | Safe D | Kerry (80.0%) | |||||||||
| Michigan | Carl Levin | 58.4% D | Safe D | Levin (60.6%) | |||||||||
| Minnesota | Dean Barkley (retiring) | Appointed (2002)[i] | Lean D (flip) | Coleman (49.5%) (flip) | |||||||||
| Mississippi | Thad Cochran | 71.0% R | Safe R | Cochran (84.6%) | |||||||||
| Missouri | Jean Carnahan | Appointed (2001)[j] | Lean R (flip) | Talent (49.8%) (flip) | |||||||||
| Montana | Max Baucus | 49.6% D | Safe D | Baucus (62.7%) | |||||||||
| Nebraska | Chuck Hagel | 56.1% R | Safe R | Hagel (82.8%) | |||||||||
| New Hampshire | Bob Smith (lost renomination) | 49.2% R | Lean D (flip) | Sununu (50.8%) | |||||||||
| New Jersey | Bob Torricelli (withdrew) | 52.7% D | Lean D | Lautenberg (53.9%) | |||||||||
| New Mexico | Pete Domenici | 64.7% R | Safe R | Domenici (65.0%) | |||||||||
| North Carolina | Jesse Helms (retiring) | 52.6% R | Lean R | Dole (53.5%) | |||||||||
| Oklahoma | Jim Inhofe | 56.7% R | Likely R | Inhofe (57.3%) | |||||||||
| Oregon | Gordon Smith | 49.8% R | Likely R | Smith (56.2%) | |||||||||
| Rhode Island | Jack Reed | 63.3% D | Safe D | Reed (78.4%) | |||||||||
| South Carolina | Strom Thurmond (retiring) | 53.4% R | Lean R | Graham (54.4%) | |||||||||
| South Dakota | Tim Johnson | 51.3% D | Lean D | Johnson (49.6%) | |||||||||
| Tennessee | Fred Thompson (retiring) | 61.4% R | Likely R | Alexander (54.3%) | |||||||||
| Texas | Phil Gramm (retiring) | 54.8% R | Lean R | Cornyn (55.3%) | |||||||||
| Virginia | John Warner | 52.5% R | Safe R | Warner (82.6%) | |||||||||
| West Virginia | Jay Rockefeller | 76.7% D | Safe D | Rockefeller (63.1%) | |||||||||
| Wyoming | Mike Enzi | 54.1% R | Safe R | Enzi (73.0%) | |||||||||
Race summary[edit]
Special elections during the 107th Congress[edit]
In these special elections, the winner was seated in the fall of 2002; ordered by election date, then state.
| State (linked to summaries below) | Incumbent | Results | Candidates | ||
|---|---|---|---|---|---|
| Senator | Party | Electoral history | |||
| Missouri (Class 1) | Jean Carnahan | Democratic | 2001 (Appointed) | Interim appointee lost election. New senator elected November 5, 2002. Republican gain. |
|
Elections leading to the next Congress[edit]
In these general elections, the winners were elected for the term beginning January 3, 2003; ordered by state.
All of the elections involved the Class 2 seats.
| State (linked to summaries below) | Incumbent | Results | Candidates | ||
|---|---|---|---|---|---|
| Senator | Party | Electoral history | |||
| Alabama | Jeff Sessions | Republican | 1996 | Incumbent re-elected. |
|
| Alaska | Ted Stevens | Republican | 1968 (Appointed) 1970 (special) 1972 1978 1984 1990 1996 | Incumbent re-elected. |
|
| Arkansas | Tim Hutchinson | Republican | 1996 | Incumbent lost re-election. New senator elected. Democratic gain. |
|
| Colorado | Wayne Allard | Republican | 1996 | Incumbent re-elected. |
|
| Delaware | Joe Biden | Democratic | 1972 1978 1984 1990 1996 | Incumbent re-elected. |
|
| Georgia | Max Cleland | Democratic | 1996 | Incumbent lost re-election. New senator elected. Republican gain. |
|
| Idaho | Larry Craig | Republican | 1990 1996 | Incumbent re-elected. |
|
| Illinois | Dick Durbin | Democratic | 1996 | Incumbent re-elected. |
|
| Iowa | Tom Harkin | Democratic | 1984 1990 1996 | Incumbent re-elected. |
|
| Kansas | Pat Roberts | Republican | 1996 | Incumbent re-elected. |
|
| Kentucky | Mitch McConnell | Republican | 1984 1990 1996 | Incumbent re-elected. |
|
| Louisiana | Mary Landrieu | Democratic | 1996 | Incumbent re-elected. |
|
| Maine | Susan Collins | Republican | 1996 | Incumbent re-elected. |
|
| Massachusetts | John Kerry | Democratic | 1984 1990 1996 | Incumbent re-elected. |
Others
|
| Michigan | Carl Levin | Democratic | 1978 1984 1990 1996 | Incumbent re-elected. |
|
| Minnesota | Dean Barkley[f] | Independence | 2002 (Appointed) | Interim appointee retired. New senator elected. Republican gain. |
Others
|
| Mississippi | Thad Cochran | Republican | 1978 1984 1990 1996 | Incumbent re-elected. |
|
| Montana | Max Baucus | Democratic | 1978 1984 1990 1996 | Incumbent re-elected. |
|
| Nebraska | Chuck Hagel | Republican | 1996 | Incumbent re-elected. |
|
| New Hampshire | Bob Smith | Republican | 1990 1996 | Incumbent lost renomination. New senator elected. Republican hold. |
|
| New Jersey | Robert Torricelli | Democratic | 1996 | Incumbent renominated but withdrew. New senator elected. Democratic hold. |
Others
|
| New Mexico | Pete Domenici | Republican | 1972 1978 1984 1990 1996 | Incumbent re-elected. |
|
| North Carolina | Jesse Helms | Republican | 1972 1978 1984 1990 1996 | Incumbent retired. New senator elected. Republican hold. |
|
| Oklahoma | Jim Inhofe | Republican | 1994 (special) 1996 | Incumbent re-elected. |
|
| Oregon | Gordon H. Smith | Republican | 1996 | Incumbent re-elected. |
|
| Rhode Island | Jack Reed | Democratic | 1996 | Incumbent re-elected. |
|
| South Carolina | Strom Thurmond | Republican | 1954 (write-in)[k] 1954 (Appointed) 1956 (Resigned) 1956 (special) 1960 1966 1972 1978 1984 1990 1996 | Incumbent retired. New senator elected. Republican hold. |
|
| South Dakota | Tim Johnson | Democratic | 1996 | Incumbent re-elected. |
|
| Tennessee | Fred Thompson | Republican | 1994 (special) 1996 | Incumbent retired. New senator elected. Republican hold. |
|
| Texas | Phil Gramm | Republican | 1984 1990 1996 | Incumbent retired. New senator elected. Republican hold. Incumbent resigned November 30, 2002, to give successor preferential seniority. Winner appointed December 2, 2002. |
|
| Virginia | John Warner | Republican | 1978 1984 1990 1996 | Incumbent re-elected. |
|
| West Virginia | Jay Rockefeller | Democratic | 1984 1990 1996 | Incumbent re-elected. |
|
| Wyoming | Mike Enzi | Republican | 1996 | Incumbent re-elected. |
|
Closest races[edit]
In eleven races the margin of victory was under 10%[13]
| District | Winner | Margin |
|---|---|---|
| South Dakota | Democratic | 0.16% |
| Missouri (special) | Republican (flip) | 1.1% |
| Minnesota | Republican (flip) | 2.2%[l] |
| Louisiana | Democratic | 3.4% |
| New Hampshire | Republican | 4.4% |
| Colorado | Republican | 4.9% |
| Georgia | Republican (flip) | 6.9% |
| Arkansas | Democratic (flip) | 7.0% |
| North Carolina | Republican | 8.6% |
| Tennessee | Republican | 9.9% |
| New Jersey | Democratic | 9.9% |
Alabama[edit]
| |||||||||||||||||
 County results Sessions: 50–60% 60–70% 70–80% Parker: 40–50% 50–60% 60–70% 70–80% 80–90% | |||||||||||||||||
| |||||||||||||||||

Since around 1980, Alabama voters had increasingly voted for Republican candidates at the federal level, especially in Presidential elections. By contrast, Democratic candidates had been elected to many state-level offices and comprised a longstanding majority in the Alabama Legislature.
Incumbent Republican Jeff Sessions was not challenged in the primary,[14] and easily won re-election to a second term.[13]
Sessions was not challenged in the primary.[14]
| Party | Candidate | Votes | % | |
|---|---|---|---|---|
| Democratic | Susan Parker | 190,978 | 47.99% | |
| Democratic | Julian L. McPhillips | 170,222 | 42.78% | |
| Democratic | Wayne Sowell | 36,719 | 9.23% | |
| Total votes | 397,919 | 100.00% | ||
McPhillips received a large amount of support in the southern part of the state, but Parker won the most votes. Sowell endorsed Parker for the run-off.
| Party | Candidate | Votes | % | |
|---|---|---|---|---|
| Democratic | Susan Parker | 176,708 | 65.15% | |
| Democratic | Julian L. McPhillips | 94,540 | 34.85% | |
| Total votes | 271,248 | 100.00% | ||
| Party | Candidate | Votes | % | ±% | |
|---|---|---|---|---|---|
| Republican | Jeff Sessions (Incumbent) | 792,561 | 58.58% | +6.13% | |
| Democratic | Susan Parker | 538,878 | 39.83% | -5.63% | |
| Libertarian | Jeff Allen | 20,234 | 1.50% | +.06% | |
| No party | Write-In Votes | 1,350 | 0.10% | +.06% | |
| Majority | 253,683 | 18.75% | |||
| Turnout | 1,353,023 | ||||
| Republican hold | Swing | ||||
Alaska[edit]
| |||||||||||||||||||||||||||||||||||||
 Results by state house district Stevens: 60–70% 70–80% 80–90% | |||||||||||||||||||||||||||||||||||||
| |||||||||||||||||||||||||||||||||||||
.jpg)

Incumbent Ted Stevens ran for and won a seventh term. He faced perennial candidate Frank Vondersaar, the Democratic nominee, journalist Jim Sykes, the Green Party nominee, and several other independent candidates in his bid for re-election. Ultimately, Stevens crushed his opponents to win what would be his last term in the Senate, allowing him to win with the largest margin of victory for any Senate election in Alaska, as well as the highest percentage of the vote in any of his elections.
| Party | Candidate | Votes | % | ±% | |
|---|---|---|---|---|---|
| Republican | Ted Stevens (Incumbent) | 179,438 | 78.17% | +1.46% | |
| Democratic | Frank Vondersaar | 24,133 | 10.51% | +0.17% | |
| Green | Jim Sykes | 16,608 | 7.24% | -5.29% | |
| Independence | Jim Dore | 6,724 | 2.93% | ||
| Libertarian | Leonard Karpinski | 2,354 | 1.03% | ||
| Write-ins | 291 | 0.13% | |||
| Majority | 155,305 | 67.66% | +3.47% | ||
| Turnout | 229,548 | ||||
| Republican hold | Swing | ||||
Arkansas[edit]
| |||||||||||||||||
 County results Pryor: 50–60% 60–70% 70–80% Hutchinson: 50–60% 60–70% | |||||||||||||||||
| |||||||||||||||||

.jpg)
Incumbent Republican Tim Hutchinson ran for a second term, but lost re-election to Arkansas Attorney General Mark Pryor.

| Party | Candidate | Votes | % | |
|---|---|---|---|---|
| Republican | Tim Hutchinson | 71,576 | 77.7% | |
| Republican | Jim Bob Duggar | 20,546 | 22.3% | |
| Total votes | 92,116 | 100.0% | ||
| Party | Candidate | Votes | % | |||
|---|---|---|---|---|---|---|
| Democratic | Mark Pryor | 435,347 | 53.9% | |||
| Republican | Tim Hutchinson (Incumbent) | 372,909 | 46.1% | |||
| Democratic gain from Republican | ||||||
Colorado[edit]
| |||||||||||||||||
 County results Allard: 40–50% 50–60% 60–70% 70–80% Strickland: 40–50% 50–60% 60–70% | |||||||||||||||||
| |||||||||||||||||


Incumbent Republican Wayne Allard won re-election to a second term.
| Party | Candidate | Votes | % | |
|---|---|---|---|---|
| Democratic | Tom Strickland | 110,309 | 100.00% | |
| Total votes | 110,309 | 100.00% | ||
| Party | Candidate | Votes | % | |
|---|---|---|---|---|
| Republican | Wayne Allard (Incumbent) | 190,250 | 100.00% | |
| Total votes | 190,250 | 100.00% | ||
| Party | Candidate | Votes | % | ±% | |
|---|---|---|---|---|---|
| Republican | Wayne Allard (Incumbent) | 717,899 | 50.70% | -0.71% | |
| Democratic | Tom Strickland | 648,130 | 45.77% | +0.03% | |
| Constitution | Douglas Campbell | 21,547 | 1.52% | ||
| Libertarian | Rick Stanley | 20,776 | 1.47% | ||
| Independent | John Heckman | 7,140 | 0.50% | ||
| Write-ins | 596 | 0.04% | |||
| Majority | 69,763 | 4.93% | -0.74% | ||
| Turnout | 1,416,082 | ||||
| Republican hold | Swing | ||||
Delaware[edit]
| |||||||||||||||||
 County results Biden: 50–60% 60–70% Clatworthy: 50–60% | |||||||||||||||||
| |||||||||||||||||

Incumbent Democrat Joe Biden won re-election to a sixth term.
| Party | Candidate | Votes | % | ±% | |
|---|---|---|---|---|---|
| Democratic | Joe Biden (Incumbent) | 135,253 | 58.22% | -1.82% | |
| Republican | Raymond J. Clatworthy | 94,793 | 40.80% | +2.67% | |
| Independent | Maurice Barros | 996 | 0.43% | ||
| Libertarian | Raymond T. Buranello | 922 | 0.40% | -0.82% | |
| Natural Law | Robert E. Mattson | 350 | 0.15% | -0.47% | |
| Majority | 40,460 | 17.42% | -4.49% | ||
| Turnout | 232,314 | ||||
| Democratic hold | Swing | ||||
Georgia[edit]
| |||||||||||||||||
 Chambliss: 40–50% 50–60% 60–70% 70–80% Cleland: 40–50% 50–60% 60–70% 70–80% | |||||||||||||||||
| |||||||||||||||||


Incumbent Democrat Max Cleland ran for re-election to a second term, but lost to Republican Saxby Chambliss.
Chambliss's campaign used the refrain of national defense and security, but drew criticism for television ads that paired images of Cleland and Osama bin Laden and Saddam Hussein, and for questioning the commitment to homeland security of his opponent, a triple amputee and decorated Vietnam veteran.[23][24] Republican Senator John McCain of Arizona said of one ad: "It's worse than disgraceful. It's reprehensible."[25] McCain, along with Republican Senator Chuck Hagel of Nebraska, made significant complaints to the Republican National Committee until the ads were taken down.[26] Nevertheless, Chambliss defeated Cleland by nearly seven percentage points.
| Party | Candidate | Votes | % | ±% | |
|---|---|---|---|---|---|
| Republican | Saxby Chambliss | 1,071,153 | 52.8% | ||
| Democratic | Max Cleland (incumbent) | 931,857 | 45.9% | ||
| Libertarian | Claude Thomas | 26,981 | 1.3% | ||
| Majority | 139,296 | 6.9% | |||
| Turnout | 2,029,991 | 100.0% | |||
| Republican gain from Democratic | Swing | ||||
Idaho[edit]
| |||||||||||||||||
| |||||||||||||||||
 County results Craig: 50–60% 60–70% 70–80% 80–90% Blinken: 50–60% | |||||||||||||||||
| |||||||||||||||||


Incumbent Republican Larry Craig won re-election to a third term.
| Party | Candidate | Votes | % | |
|---|---|---|---|---|
| Democratic | Alan Blinken | 26,346 | 70.90% | |
| Democratic | Dave Sneddon | 10,812 | 29.10% | |
| Total votes | 37,158 | 100.00% | ||
| Party | Candidate | Votes | % | |
|---|---|---|---|---|
| Libertarian | Donovan Bramwell | 1,179 | 100.00% | |
| Total votes | 1,179 | 100.00% | ||
| Party | Candidate | Votes | % | |
|---|---|---|---|---|
| Republican | Larry Craig (Incumbent) | 130,126 | 100.00% | |
| Total votes | 130,126 | 100.00% | ||
| Party | Candidate | Votes | % | ±% | |
|---|---|---|---|---|---|
| Republican | Larry Craig (Incumbent) | 266,215 | 65.16% | +8.14% | |
| Democratic | Alan Blinken | 132,975 | 32.55% | -7.36% | |
| Libertarian | Donovan Bramwell | 9,354 | 2.29% | ||
| Majority | 133,240 | 32.61% | +15.50% | ||
| Turnout | 408,544 | ||||
| Republican hold | Swing | ||||
Illinois[edit]
| |||||||||||||||||
 County results Durbin: 40–50% 50–60% 60–70% 70–80% Durkin: 40–50% 50–60% 60–70% | |||||||||||||||||
| |||||||||||||||||

Incumbent Democrat Dick Durbin won re-election to a second term. Durbin faced off against State Representative and future Illinois House minority leader Jim Durkin, whom he was able to beat, ensuring his return to the Senate.
| Party | Candidate | Votes | % | |
|---|---|---|---|---|
| Democratic | Dick Durbin (Incumbent) | 918,467 | 100.00% | |
| Total votes | 918,467 | 100.00% | ||
| Party | Candidate | Votes | % | |
|---|---|---|---|---|
| Republican | Jim Durkin | 378,010 | 45.81% | |
| Republican | Jim Oberweis | 259,515 | 31.45% | |
| Republican | John H. Cox | 187,706 | 22.74% | |
| Total votes | 825,231 | 100.00% | ||
Durbin won re-election to a second term easily, carrying a majority of the states 102 counties.
| Party | Candidate | Votes | % | ±% | |
|---|---|---|---|---|---|
| Democratic | Dick Durbin (Incumbent) | 2,103,766 | 60.33% | +4.25% | |
| Republican | Jim Durkin | 1,325,703 | 38.02% | -2.65% | |
| Libertarian | Steven Burgauer | 57,382 | 1.65% | +0.68% | |
| Majority | 778,063 | 22.31% | +6.90% | ||
| Turnout | 3,486,851 | ||||
| Democratic hold | Swing | ||||
Iowa[edit]
| |||||||||||||||||
 County results Harkin: 40–50% 50–60% 60–70% Ganske: 40-50% 50-60% 60-70% 80-90% | |||||||||||||||||
| |||||||||||||||||


Incumbent Democrat Tom Harkin won re-election to a fourth term. Harkin was opposed in the general election by United States Congressman Greg Ganske, who fought off a surprisingly difficult challenger in the Republican primary. Though Harkin had narrowly defeated his opponent six years earlier, he was able to defeat Ganske by a fairly comfortable margin to win re-election.
| Party | Candidate | Votes | % | |
|---|---|---|---|---|
| Democratic | Tom Harkin (Incumbent) | 83,505 | 99.34% | |
| Democratic | Write-ins | 555 | 0.66% | |
| Total votes | 84,060 | 100.00% | ||
| Party | Candidate | Votes | % | |
|---|---|---|---|---|
| Republican | Greg Ganske | 116,229 | 58.97% | |
| Republican | Bill Salier | 80,700 | 40.95% | |
| Republican | Write-ins | 167 | 0.08% | |
| Total votes | 197,096 | 100.00% | ||
| Party | Candidate | Votes | % | ±% | |
|---|---|---|---|---|---|
| Democratic | Tom Harkin (Incumbent) | 554,278 | 54.18% | +2.37% | |
| Republican | Greg Ganske | 447,892 | 43.78% | -2.94% | |
| Green | Timothy A. Harthan | 11,340 | 1.11% | ||
| Libertarian | Richard J. Moore | 8,864 | 0.87% | ||
| Write-ins | 701 | 0.06% | |||
| Majority | 106,386 | 10.40% | +5.30% | ||
| Turnout | 1,023,075 | ||||
| Democratic hold | Swing | ||||
Kansas[edit]
| |||||||||||||||||||||
 County results Roberts: 50–60% 70–80% 80–90% >90% | |||||||||||||||||||||
| |||||||||||||||||||||

Incumbent Pat Roberts won re-election to a second term easily because no Democrat filed to run.
| Party | Candidate | Votes | % | |
|---|---|---|---|---|
| Republican | Pat Roberts (Incumbent) | 233,642 | 83.70% | |
| Republican | Tom Oyler | 45,491 | 16.30% | |
| Total votes | 279,133 | 100.00% | ||
| Party | Candidate | Votes | % | ±% | |
|---|---|---|---|---|---|
| Republican | Pat Roberts (Incumbent) | 641,075 | 82.52% | +20.50% | |
| Libertarian | Steven Rosile | 70,725 | 9.10% | +7.86% | |
| Reform | George Cook | 65,050 | 8.37% | +6.08% | |
| Majority | 570,350 | 73.42% | +45.83% | ||
| Turnout | 776,850 | ||||
| Republican hold | Swing | ||||
Kentucky[edit]
| |||||||||||||||||
 County results McConnell: 50–60% 60–70% 70–80% 80–90% Weinberg: 50–60% 60–70% | |||||||||||||||||
| |||||||||||||||||

Incumbent Republican Mitch McConnell won re-election to a fourth term.
| Party | Candidate | Votes | % | |
|---|---|---|---|---|
| Democratic | Lois Combs Weinberg | 231,013 | 50.10% | |
| Democratic | Tom Barlow | 230,055 | 49.90% | |
| Total votes | 461,068 | 100.00% | ||
| Party | Candidate | Votes | % | ±% | |
|---|---|---|---|---|---|
| Republican | Mitch McConnell (Incumbent) | 731,679 | 64.68% | +9.22% | |
| Democratic | Lois Combs Weinberg | 399,634 | 35.32% | -7.52% | |
| Majority | 332,045 | 29.35% | +16.74% | ||
| Turnout | 1,131,313 | ||||
| Republican hold | Swing | ||||
Louisiana[edit]
| |||||||||||||||||
| |||||||||||||||||

| |||||||||||||||||
| |||||||||||||||||

Incumbent Democrat Mary Landrieu won re-election to a second term.
During the run-off, Landrieu was out-spent three-to-one by Republican contender Suzanne Haik Terrell, the Louisiana Elections Commissioner. Terrell also had prominent Republicans including President George W. Bush and Vice President Dick Cheney visit Louisiana to campaign on her behalf. Republicans, confident of victory having gained seats in the elections to the House of Representatives and to the Senate, solidifying control of the former and taking control of the latter, publicly called the election "Operation Icing on the Cake".[32][33] Some Democrats[who?] responded by calling their efforts "Operation Wipe that Smirk off of Bush's Face"[34] and dubbed Landrieu's subsequent run-off victory, "Operation Pie in the Face".[35]
| Party | Candidate | Votes | % | ±% | |
|---|---|---|---|---|---|
| Democratic | Mary Landrieu (Incumbent) | 573,347 | 46.00% | ||
| Republican | Suzanne Haik Terrell | 339,506 | 27.24% | ||
| Republican | John Cooksey | 171,752 | 13.78% | ||
| Republican | Tony Perkins | 119,776 | 9.61% | ||
| Democratic | Raymond Brown | 23,553 | 1.89% | ||
| Independent | Patrick E. "Live Wire" Landry | 10,442 | 0.84% | ||
| Independent | James Lemann | 3,866 | 0.31% | ||
| Libertarian | Gary D. Robbins | 2,423 | 0.19% | ||
| Republican | Ernest Edward Skillman, Jr. | 1,668 | 0.13% | ||
| Turnout | 1,246,333 | 100.00% | |||
Landrieu pulled off what many[by whom?] considered to be an upset victory. The Republicans believed they would most likely win the race. Before the election many Republicans called the race operation icing on the cake. After Landrieu won the runoff Democrats dubbed her victory operation pie in the face. The race was close. In terms of rural parishes the vote was split fairly evenly. Landrieu did well in Caddo Parish home of Shreveport, and in East Baton Rouge Parish home of East Baton Rouge. Ultimately though it was Landrieu's huge win in Orleans Parish home of New Orleans that pushed her over the finish line. Haik Terrell conceded defeat to Landrieu at 12:38 p.m. EST, congratulating Landrieu on her victory. Landrieu would go on to be re-elected to a third term in 2008.[citation needed]
| Party | Candidate | Votes | % | ±% | |
|---|---|---|---|---|---|
| Democratic | Mary Landrieu (Incumbent) | 638,654 | 51.70% | +1.53% | |
| Republican | Suzanne Haik Terrell | 596,642 | 48.30% | -1.53% | |
| Majority | 42,012 | 3.40% | +3.06% | ||
| Turnout | 1,235,296 | 100.00% | |||
| Democratic hold | Swing | ||||
Maine[edit]
| |||||||||||||||||
  Collins: 40–50% 50–60% 60–70% 70–80% 80–90% >90% Pingree: 40–50% 50–60% 60–70% 70–80% Tie: 50–60% | |||||||||||||||||
| |||||||||||||||||


Incumbent Republican Susan Collins won re-election to a second term.
Chellie Pingree, State Senator and Senate Majority Leader attacked Collins for supporting the Bush tax cuts.[36] Both candidates opposed the Iraq War in the fall of 2002.[37] However, Collins then supported the congressional resolution to attack Iraq, while Pingree opposed it.[38]
Collins, a popular moderate, was supported by health care groups, environmentalists and gay rights advocates. She handily defeated State Senator Chellie Pingree of North Haven in one of the few U.S. Senate elections in which both major parties nominated women in U.S. history.[39]
| Party | Candidate | Votes | % | ±% | |
|---|---|---|---|---|---|
| Republican | Susan Collins (Incumbent) | 295,041 | 58.44% | +9.25% | |
| Democratic | Chellie Pingree | 209,858 | 41.56% | -2.31% | |
| Majority | 85,183 | 16.87% | +11.57% | ||
| Turnout | 504,899 | ||||
| Republican hold | Swing | ||||
Massachusetts[edit]
| |||||||||||||||||
  Kerry: 50–60% 60–70% 70–80% 80–90% | |||||||||||||||||
| |||||||||||||||||

Incumbent Democrat John Kerry won re-election to a fourth term against Libertarian Michael Cloud. The lack of a Republican party candidate caused Cloud to receive the largest percentage of votes for a U.S. Senate candidate in the Libertarian Party's history, though this record has since been eclipsed by Joe Miller in Alaska in 2016, and again by Ricky Dale Harrington in Arkansas in 2020.
| Party | Candidate | Votes | % | ±% | |
|---|---|---|---|---|---|
| Democratic | John F. Kerry (Incumbent) | 1,605,976 | 72.33% | ||
| Libertarian | Michael Cloud | 369,807 | 16.66% | ||
| Independent | Randall Forsberg (write-in) | 24,898 | 1.12% | ||
| All others | 6,077 | 0.27% | |||
| Blank / Scattering | 213,543 | 9.62% | |||
| Total votes | 2,220,301 | 100% | |||
Michigan[edit]
| |||||||||||||||||
 Levin: 40-50% 50–60% 60–70% 70–80% Raczkowski: 40–50% 50–60% 60–70% | |||||||||||||||||
| |||||||||||||||||


Incumbent Democrat Carl Levin won re-election to a fifth term.
| Party | Candidate | Votes | % | ±% | |
|---|---|---|---|---|---|
| Democratic | Carl Levin (Incumbent) | 1,896,614 | 60.61% | +2.25% | |
| Republican | Andrew Raczkowski | 1,185,545 | 37.89% | -1.98% | |
| Green | Eric Borregard | 23,931 | 0.76% | +0.76% | |
| Reform | John Mangopoulos | 12,831 | 0.41% | +0.41% | |
| Natural Law | Doug Dern | 10,366 | 0.33% | +0.03% | |
| Majority | 711,069 | 22.72% | +4.23% | ||
| Turnout | 3,129,287 | ||||
| Democratic hold | Swing | ||||
Minnesota[edit]
| |||||||||||||||||
 Coleman: 40–50% 50–60% 60–70% Mondale: 40–50% 50–60% 60–70% | |||||||||||||||||
| |||||||||||||||||
.jpg)

Incumbent Democrat Paul Wellstone was running for re-election to a third term, but died in a plane crash eleven days before the election. The Democratic–Farmer–Labor Party (DFL) chose former Vice President and 1984 Presidential candidate Walter Mondale to replace Wellstone on the ballot. Mondale lost to Republican Mayor of Saint Paul Norm Coleman. The day before the election, Independence Governor Jesse Ventura had appointed Dean Barkley (IP) to serve the rest of Wellstone's term.[43] As of 2023[update], this was the last Senate election in Minnesota won by a Republican.
In the primaries, Paul Wellstone defeated Dick Franson 93% to 5% and Norm Coleman defeated Jack Shepard 95% to 5%.
At the time of his death, Wellstone was slightly ahead in the polls. After Walter Mondale was chosen as the DFL candidate, in a poll taken a few days before the election Mondale was leading 51% to 45%. Early on Election Day, Mondale was leading in votes. By nightfall, however, Norm Coleman pulled ahead, winning by 49.5 percent to 47.3 percent.
Paul Wellstone still appeared on the ballot despite his death, despite a court order replacing Wellstone's name with Mondale's.
| Party | Candidate | Votes | % | ±% | |
|---|---|---|---|---|---|
| Republican | Norm Coleman | 1,116,697 | 49.53% | +8.25% | |
| Democratic (DFL) | Walter Mondale | 1,067,246 | 47.34% | -2.98% | |
| Independence | Jim Moore | 45,139 | 2.00% | -4.98% | |
| Democratic (DFL) | Paul Wellstone (Incumbent, deceased) | 11,381 | 0.50% | n/a | |
| Green | Ray Tricomo | 10,119 | 0.48% | n/a | |
| Constitution | Miro Drago Kovatchevich | 2,254 | 0.10% | n/a | |
| Write-ins | 1,803 | 0.80% | n/a | ||
| Majority | 49,451 | 2.19% | Republican gain from Independence | ||
| Turnout | 2,254,639 | 80.26% | |||
| Republican gain from Independence | Swing | ||||
Mississippi[edit]
| |||||||||||||||||
 County results Cochran: 60–70% 70–80% 80–90% >90% | |||||||||||||||||
| |||||||||||||||||

Incumbent Republican Thad Cochran overwhelmingly won re-election to a fifth term. The Democratic Party did not field a candidate, resulting in Reform Party candidate Shawn O'Hara winning 15.42% of the vote.
| Party | Candidate | Votes | % | ±% | |
|---|---|---|---|---|---|
| Republican | Thad Cochran (incumbent) | 533,269 | 84.58% | ||
| Reform | Shawn O'Hara | 97,226 | 15.42% | ||
| Majority | 436,043 | 69.16% | |||
| Turnout | 630,495 | ||||
| Republican hold | Swing | ||||
Missouri (special)[edit]
| |||||||||||||||||
 County results Talent: 40-50% 50-60% 60-70% 70-80% Carnahan: 40–50% 50–60% 60–70% 70–80% | |||||||||||||||||
| |||||||||||||||||


In the 2000 election, Mel Carnahan, who had died in a plane crash three weeks before, remained on the ballot for election to the Senate. Carnahan beat his Republican opponent, John Ashcroft, who did not legally contest being defeated by a dead candidate. Carnahan's successor as governor, Roger B. Wilson, fulfilled his pre-election promise to appoint Carnahan's widow in her husband's place and a special election was scheduled for 2002.[44][45]
The election would decide who would serve the rest of Senator-elect Mel Carnahan's term, after he died. The winner would serve four more years until the next election in 2006. Governor Roger Wilson had appointed Carnahan's widow Jean to serve temporarily. She then ran for the remainder of the term. Republican Jim Talent defeated her narrowly. While the race would have flipped control of the Senate from the Democrats to the Republicans, the Senate was adjourned, so no change in leadership occurred until the 108th Congress began in January 2003.
| Party | Candidate | Votes | % | |
|---|---|---|---|---|
| Democratic | Jean Carnahan (Incumbent) | 368,149 | 83.22 | |
| Democratic | Darrel D. Day | 74,237 | 16.78 | |
| Total votes | 442,386 | 100.00 | ||
| Party | Candidate | Votes | % | |
|---|---|---|---|---|
| Republican | Jim Talent | 395,994 | 89.58 | |
| Republican | Joseph A. May | 18,525 | 4.19 | |
| Republican | Doris Bass Landfather | 14,074 | 3.18 | |
| Republican | Scott Craig Babbitt | 7,705 | 1.74 | |
| Republican | Martin Lindstedt | 5,773 | 1.31 | |
| Total votes | 442,071 | 100.00 | ||
| Party | Candidate | Votes | % | |
|---|---|---|---|---|
| Libertarian | Tamara A. Millay | 1,942 | 59.35 | |
| Libertarian | Edward Joseph Manley | 1,330 | 40.65 | |
| Total votes | 3,272 | 100.00 | ||
National security and Carnahan's vote against fellow Missourian John Ashcroft as attorney general were major issues in the campaign. Republicans argued Carnahan owed her vote to Ashcroft, who had lost his bid for re-election to the Senate to Carnahan's husband.[47] Talent, citing Carnahan's votes against homeland-security legislation and missile defense, accused her of being soft on national security, which she objected to, saying he was "doubt[ing] her patriotism."[48]
Jack Abramoff contributed $2,000 to Talent's 2002 senatorial campaign,[49] and Preston Gates & Ellis, a former Abramoff employer, had also contributed $1,000 to Talent's campaign.[50] Talent later returned both contributions.[51] Talent's win returned Republican control of the Senate which had been under slight Democratic dominance resulting from Vermont junior senator Jim Jeffords's decision to renounce the Republican Party, turning independent and making the choice to caucus with the Democrats.
Talent's victory was certified November 21, 2002, one day before Congress adjourned, which prevented Republicans from claiming a senate majority. He automatically became a Senator the following day because, under federal law, he formally took office as soon as special election results were certified and the day after both chambers of Congress adjourned. Because Republicans would hold the majority in the following Congress, they saw no need to hold a special session in the 107th to take advantage of their brief majority.[52][53]
| Party | Candidate | Votes | % | ±% | |
|---|---|---|---|---|---|
| Republican | Jim Talent | 935,032 | 49.80% | +1.41% | |
| Democratic | Jean Carnahan (Incumbent) | 913,778 | 48.67% | -1.80% | |
| Libertarian | Tamara A. Millay | 18,345 | 0.98% | +0.55% | |
| Green | Daniel Romano | 10,465 | 0.56% | +0.11% | |
| Majority | 21,254 | 1.13% | -0.94% | ||
| Turnout | 1,877,620 | ||||
| Republican gain from Democratic | Swing | ||||
Montana[edit]
| |||||||||||||||||
| |||||||||||||||||
 County results Baucus: 40–50% 50–60% 60–70% 70–80% 80–90% Taylor: 40–50% 50–60% | |||||||||||||||||
| |||||||||||||||||

Incumbent Democrat Max Baucus won re-election to a fifth term.[54]
| Party | Candidate | Votes | % | |
|---|---|---|---|---|
| Democratic | Max Baucus (Incumbent) | 66,713 | 100.00% | |
| Total votes | 66,713 | 100.00% | ||
| Party | Candidate | Votes | % | |
|---|---|---|---|---|
| Republican | Mike Taylor | 48,169 | 60.16% | |
| Republican | Brad Johnson | 14,252 | 17.80% | |
| Republican | John McDonald | 10,116 | 12.63% | |
| Republican | Melvin Hanson | 7,536 | 9.41% | |
| Total votes | 80,073 | 100.00% | ||
The election got national attention when Baucus's opponent, state senator Mike Taylor, accused Baucus of having implied that Taylor was gay in a campaign ad. The ad was paid for by the Democratic Senatorial Campaign Committee, though designed by the Baucus campaign. The ad, which alleged that Taylor had embezzled funds from the cosmetology school he once owned, showed footage from the early 1980s of Taylor massaging another man's face while wearing a tight suit with an open shirt. Due to financial shortages making it impossible for him to continue the race and having concerns about the effect the race was having on his family, Taylor dropped out of the race and Baucus won with 63 percent of the vote.[56]
| Party | Candidate | Votes | % | ±% | |
|---|---|---|---|---|---|
| Democratic | Max Baucus (incumbent) | 204,853 | 62.74% | +13.18% | |
| Republican | Mike Taylor | 103,611 | 31.73% | -12.96% | |
| Libertarian | Stan Jones | 10,420 | 3.19% | ||
| Green | Bob Kelleher | 7,653 | 2.34% | ||
| Majority | 101,242 | 31.00% | +26.14% | ||
| Turnout | 326,537 | ||||
| Democratic hold | Swing | ||||
Nebraska[edit]
| |||||||||||||||||
| |||||||||||||||||
 County results Hagel: 60-70% 70-80% 80-90% >90% | |||||||||||||||||
| |||||||||||||||||

Incumbent Republican Chuck Hagel won re-election to a second term.
| Party | Candidate | Votes | % | |
|---|---|---|---|---|
| Democratic | Charlie A. Matulka | 33,922 | 59.31% | |
| Democratic | Al Hamburg | 23,272 | 40.69% | |
| Total votes | 57,194 | 100.00% | ||
| Party | Candidate | Votes | % | |
|---|---|---|---|---|
| Libertarian | John J. Graziano | 228 | 100.00% | |
| Total votes | 228 | 100.00% | ||
| Party | Candidate | Votes | % | |
|---|---|---|---|---|
| Republican | Chuck Hagel (Incumbent) | 144,160 | 100.00% | |
| Total votes | 144,160 | 100.00% | ||
| Party | Candidate | Votes | % | ±% | |
|---|---|---|---|---|---|
| Republican | Chuck Hagel (Incumbent) | 397,438 | 82.76% | +25.36% | |
| Democratic | Charlie A. Matulka | 70,290 | 14.64% | -27.96% | |
| Libertarian | John J. Graziano | 7,423 | 1.55% | ||
| Independent | Phil Chase | 5,066 | 1.05% | ||
| Majority | 327,148 | 68.13% | +53.31% | ||
| Turnout | 480,217 | ||||
| Republican hold | Swing | ||||
New Hampshire[edit]
| |||||||||||||||||
  Sununu: 40–50% 50–60% 60–70% 70–80% >90% Shaheen: 40–50% 50–60% 60–70% 70–80% >90% Tie: 40–50% | |||||||||||||||||
| |||||||||||||||||


Incumbent Republican/Independent U.S. Senator Bob Smith was defeated in the Republican primary and denied renomination.[11] Republican John E. Sununu won the open seat. As of 2017, this is the last time a Republican has won the Class 2 Senate seat in New Hampshire.
Senator Bob Smith, the incumbent Republican Senator, briefly left the party in 1999 to run for president as an independent, claiming that the Republican platform was "not worth the paper it's written on".[58] He rejoined the GOP a few months later, saying he made a mistake.[58] Nonetheless, the party never fully forgave him, and some of his fellow Republican Senators went so far as to endorse his primary opponent, Rep. John Sununu,[59] who would go on to win by 8 points.
| Party | Candidate | Votes | % | |
|---|---|---|---|---|
| Republican | John Sununu | 81,920 | 53.35% | |
| Republican | Bob Smith (Incumbent) | 68,608 | 44.68% | |
| Total votes | 150,528 | 100.00% | ||
During the campaign, there was a major scandal that involved the use of a telemarketing firm hired by that state's Republican Party (NHGOP) for election tampering. The GOP Marketplace, based in Northern Virginia, jammed another phone bank being used by the state Democratic Party and the firefighters' union for efforts to turn out voters on behalf of New Hampshire Governor Jeanne Shaheen on Election Day. The tampering involved using a call center to jam the phone lines of a Get Out the Vote (GOTV) operation. In the end, 900 calls were made for 45 minutes of disruption to the Democratic-leaning call centers. In addition to criminal prosecutions, disclosures in the case came from a civil suit filed by the state's Democratic Party against the state's Republican Party (now settled). Four of those involved were convicted of, or pleaded guilty to, federal crimes and sentenced to prison for their involvement as of 2018[update]. One conviction was reversed by an appeals court, a decision prosecutors appealed. James Tobin, the defendant freed on appeal, was later indicted on charges of lying to the FBI during the original investigation.
| Party | Candidate | Votes | % | ±% | |
|---|---|---|---|---|---|
| Republican | John Sununu | 227,229 | 50.8% | ||
| Democratic | Jeanne Shaheen | 207,478 | 46.4% | ||
| Libertarian | Ken Blevens | 9,835 | 2.2% | ||
| Republican hold | Swing | [citation needed] | |||
New Jersey[edit]
| |||||||||||||||||
 Lautenberg: 40–50% 50–60% 60–70% 70–80% Forrester: 50–60% 60–70% | |||||||||||||||||
| |||||||||||||||||

The race was to originally feature Democrat Robert Torricelli, who was running for a second term in the seat he had won when former Senator Bill Bradley elected not to run for a fourth term in 1996 and who had been the state's senior Senator following Frank Lautenberg's retirement at the end of the 106th United States Congress, against former West Windsor Township mayor Douglas Forrester, who had won the Republican nomination.
Torricelli, however, had been the target of an ethics probe and eventually dropped out of the race on September 30 due to ethical concerns and poor poll numbers against Forrester, a relatively unknown opponent.[62] The New Jersey Democratic Party convinced the retired Lautenberg to join the race after Torricelli dropped out. In the case of The New Jersey Democratic Party v. Samson, 175 N.J. 178 (2002), Forrester sued to stop Democratic Party efforts to have Lautenberg replace Torricelli. The New Jersey Supreme Court ruled unanimously on October 2 that the party could switch Lautenberg's name in for Sen. Torricelli's on the ballot.[63] Forrester received the endorsement of President George W. Bush.[64]
In the general election, Lautenberg defeated Forrester and became the state's junior Senator for the second time when he was sworn in on January 3, 2003 (Bradley, elected in 1978, was the senior Senator during Lautenberg's first fourteen years in office and Jon Corzine, who was elected to Lautenberg's old Senate seat, became the senior Senator in 2003 as Lautenberg's previous eighteen years in the Senate were not counted towards seniority.
| Party | Candidate | Votes | % | ±% | |
|---|---|---|---|---|---|
| Democratic | Frank Lautenberg | 1,138,193 | 53.88% | ||
| Republican | Doug Forrester | 928,439 | 43.95% | ||
| Green | Ted Glick | 24,308 | 1.15% | ||
| Libertarian | Elizabeth Macron | 12,558 | 0.59% | ||
| Conservative | Norman E. Wahner | 6,404 | 0.30% | ||
| Socialist | Greg Pason | 2,702 | 0.13% | ||
| Majority | 209,754 | 9.93% | |||
| Turnout | |||||
| Democratic hold | Swing | ||||
New Mexico[edit]
| |||||||||||||||||
 County results Domenici: 50–60% 60–70% 70–80% 80–90% Tristani: 50–60% | |||||||||||||||||
| |||||||||||||||||


Incumbent Republican Pete Domenici won re-election to a sixth term. As of 2022, this is the last Senate election in New Mexico won by a Republican.
| Party | Candidate | Votes | % | |
|---|---|---|---|---|
| Democratic | Gloria Tristani | 109,084 | 77.71% | |
| Democratic | Francesa Lobato | 31,228 | 22.24% | |
| Democratic | Don E. Durham (write-in) | 73 | 0.05% | |
| Total votes | 140,385 | 100.00% | ||
| Party | Candidate | Votes | % | |
|---|---|---|---|---|
| Republican | Pete Domenici (Incumbent) | 91,898 | 99.93% | |
| Republican | Orlin G. Cole (write-in) | 62 | 0.07% | |
| Total votes | 91,960 | 100.00% | ||
| Party | Candidate | Votes | % | ±% | |
|---|---|---|---|---|---|
| Republican | Pete Domenici (Incumbent) | 314,193 | 65.04% | +0.32% | |
| Democratic | Gloria Tristani | 168,863 | 34.96% | +5.17% | |
| Majority | 145,324 | 30.09% | -4.86% | ||
| Turnout | 483,056 | ||||
| Republican hold | Swing | ||||
North Carolina[edit]
| |||||||||||||||||
 County results Dole: 40–50% 50–60% 60–70% 70–80% Bowles: 40–50% 50–60% 60–70% 70–80% | |||||||||||||||||
| |||||||||||||||||

.jpg)
Incumbent Republican Jesse Helms decided to retire due to health issues. Republican Elizabeth Dole won the open seat over Democrat Erskine Bowles, former White House Chief of Staff.
| Party | Candidate | Votes | % | ±% | |
|---|---|---|---|---|---|
| Democratic | Erskine Bowles | 277,329
| |||