2008 United States Senate elections
 From Wikipedia the free encyclopedia
| ||||||||||||||||||||||||||||||||||||||||||||||||||||||||||||||||||||
35 of the 100 seats in the United States Senate 51 seats needed for a majority | ||||||||||||||||||||||||||||||||||||||||||||||||||||||||||||||||||||
|---|---|---|---|---|---|---|---|---|---|---|---|---|---|---|---|---|---|---|---|---|---|---|---|---|---|---|---|---|---|---|---|---|---|---|---|---|---|---|---|---|---|---|---|---|---|---|---|---|---|---|---|---|---|---|---|---|---|---|---|---|---|---|---|---|---|---|---|---|
| ||||||||||||||||||||||||||||||||||||||||||||||||||||||||||||||||||||
 | ||||||||||||||||||||||||||||||||||||||||||||||||||||||||||||||||||||
.jpg)
.jpg)
The 2008 United States Senate elections were held on November 4, 2008, with 35 of the 100 seats in the Senate being contested. Thirty-three seats were up for regular elections; the winners were eligible to serve six-year terms from January 3, 2009, to January 3, 2015, as members of Class 2. There were also two special elections, the winners of those seats would finish the terms that ended on January 3, 2013. The presidential election, which was won by Democrat Barack Obama, elections for all House of Representatives seats; elections for several gubernatorial elections; and many state and local elections occurred on the same date.
Going into these elections, the Senate consisted of 49 Democrats, 49 Republicans, and two Independents who caucused with the Democrats, giving the Democratic caucus the slightest 51–49 majority.[2] Of the seats up for election in 2008, 23 were held by Republicans and 12 by Democrats. The Republicans, who openly conceded early on that they would not be able to regain the majority in this election,[3][4] lost eight seats. Democratic candidates defeated Republican incumbents in Alaska; New Hampshire; North Carolina; Oregon; and, after a lengthy recount process, Minnesota. Additionally, they won Republican-held open seats in Colorado, New Mexico, and Virginia. This election cycle was the second cycle in a row in which no seats switched from Democratic to Republican, and the first since 1990 in which the Democrats retained all their seats. In addition, this was the largest Democratic Senate gain since 1986, where they also won eight seats. These elections marked the first time since 1964 in which a Democratic presidential candidate who won the White House had a Senate coattail effect.
Along with two independents who caucus with them, Democrats held at least 58 seats as a result of the elections. The April 2009 party switch of Pennsylvania senator Arlen Specter from Republican to Democrat and the July 2009 resolution of the Minnesota election in favor of Democrat Al Franken increased the Democratic majority to 60–40 (briefly providing the Democrats a supermajority, and thus they were able to hypothetically over-ride any filibusters). Republicans gained a seat in a January 2010 special election in Massachusetts, thereby making the balance 59–41 before the start of the next election cycle.
As of 2023, this is the last time Democrats won U.S. Senate seats in Alaska, Arkansas, Iowa, Louisiana, North Carolina, and South Dakota.
Results summary[edit]
| 57 | 2 | 41 |
| Democratic | Independent | Republican |
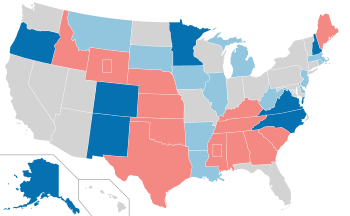
Summary of the 2008 United States Senate elections results
| Parties | Total | |||||||||||||||||||||||||||||||||||||||||||||||||||||||||||||||||||||||||||||||||||||||||||||||||
|---|---|---|---|---|---|---|---|---|---|---|---|---|---|---|---|---|---|---|---|---|---|---|---|---|---|---|---|---|---|---|---|---|---|---|---|---|---|---|---|---|---|---|---|---|---|---|---|---|---|---|---|---|---|---|---|---|---|---|---|---|---|---|---|---|---|---|---|---|---|---|---|---|---|---|---|---|---|---|---|---|---|---|---|---|---|---|---|---|---|---|---|---|---|---|---|---|---|---|
| Democratic | Republican | Independent | Libertarian | Independence | Green | Others | ||||||||||||||||||||||||||||||||||||||||||||||||||||||||||||||||||||||||||||||||||||||||||||
| Before these elections | 49 | 49 | 2 | — | — | — | — | 100 | ||||||||||||||||||||||||||||||||||||||||||||||||||||||||||||||||||||||||||||||||||||||||||
| Not up | Class 1 (2006→2012) | 22 | 8 | 2 | — | — | — | — | 31 | |||||||||||||||||||||||||||||||||||||||||||||||||||||||||||||||||||||||||||||||||||||||||
| Class 3 (2004→2010) | 15 | 19 | — | — | — | — | — | 34 | ||||||||||||||||||||||||||||||||||||||||||||||||||||||||||||||||||||||||||||||||||||||||||
| Total | 37 | 26 | 2 | — | — | — | — | 65 | ||||||||||||||||||||||||||||||||||||||||||||||||||||||||||||||||||||||||||||||||||||||||||
| Up | Class 1 | — | 2 | — | — | — | — | — | 2 | |||||||||||||||||||||||||||||||||||||||||||||||||||||||||||||||||||||||||||||||||||||||||
| Class 2 | 12 | 21 | — | — | — | — | — | 33 | ||||||||||||||||||||||||||||||||||||||||||||||||||||||||||||||||||||||||||||||||||||||||||
| Total | 12 | 23 | — | — | — | — | — | 35 | ||||||||||||||||||||||||||||||||||||||||||||||||||||||||||||||||||||||||||||||||||||||||||
| Incumbent retired | Total before | — | 5 | — | — | — | — | — | 5 | |||||||||||||||||||||||||||||||||||||||||||||||||||||||||||||||||||||||||||||||||||||||||
| Held by same party | — | 2 | — | — | — | — | — | 2 | ||||||||||||||||||||||||||||||||||||||||||||||||||||||||||||||||||||||||||||||||||||||||||
| Replaced by other party | replaced by | — | — | — | — | — | 3 | |||||||||||||||||||||||||||||||||||||||||||||||||||||||||||||||||||||||||||||||||||||||||||
| Result after | 3 | 2 | — | — | — | — | — | 5 | ||||||||||||||||||||||||||||||||||||||||||||||||||||||||||||||||||||||||||||||||||||||||||
| Incumbent ran | Total before | 12 | 18 | — | — | — | — | — | 30 | |||||||||||||||||||||||||||||||||||||||||||||||||||||||||||||||||||||||||||||||||||||||||
| Won election | 12 | 13 | — | — | — | — | — | 25 | ||||||||||||||||||||||||||||||||||||||||||||||||||||||||||||||||||||||||||||||||||||||||||
| Lost election | replaced by | — | — | — | — | — | 5 | |||||||||||||||||||||||||||||||||||||||||||||||||||||||||||||||||||||||||||||||||||||||||||
| Result after | 17 | 13 | — | — | — | — | — | 30 | ||||||||||||||||||||||||||||||||||||||||||||||||||||||||||||||||||||||||||||||||||||||||||
| Net gain/loss | — | — | — | — | — | 8 | ||||||||||||||||||||||||||||||||||||||||||||||||||||||||||||||||||||||||||||||||||||||||||||
| Total elected | 20 | 15 | — | — | — | — | — | 35 | ||||||||||||||||||||||||||||||||||||||||||||||||||||||||||||||||||||||||||||||||||||||||||
| Nation-wide vote | Votes[A] | 33,650,061 | 28,863,067 | 176,752 | 798,154 | 450,702 | 427,427 | 496,124 | 64,862,287 | |||||||||||||||||||||||||||||||||||||||||||||||||||||||||||||||||||||||||||||||||||||||||
| Share | 51.88% | 44.50% | 0.27% | 1.23% | 0.69% | 0.66% | 0.76% | 100% | ||||||||||||||||||||||||||||||||||||||||||||||||||||||||||||||||||||||||||||||||||||||||||
| Result | 57 | 41 | 2 | — | — | — | — | 100 | ||||||||||||||||||||||||||||||||||||||||||||||||||||||||||||||||||||||||||||||||||||||||||
- ^ For the Georgia senate race, votes from the runoff election are counted.
Sources:
- Clerk of the U.S. House of Representatives[1]
- U.S. Senate Popular Vote and FEC Total Receipts by Party, via TheGreenPapers.com
- "U.S. Senate (Full results)". CNN. July 1, 2009. Retrieved November 29, 2017.
- "The Green Papers 2008 U.S. Senate Popular Vote and FEC Total Receipts by Party". The Green Papers. Retrieved November 19, 2008.
Change in composition[edit]
Before the elections[edit]
| D1 | D2 | D3 | D4 | D5 | D6 | D7 | D8 | D9 | D10 |
| D20 | D19 | D18 | D17 | D16 | D15 | D14 | D13 | D12 | D11 |
| D21 | D22 | D23 | D24 | D25 | D26 | D27 | D28 | D29 | D30 |
| D40 Ill. Ran | D39 Del. Ran | D38 Ark. Ran | D37 | D36 | D35 | D34 | D33 | D32 | D31 |
| D41 Iowa Ran | D42 La. Ran | D43 Mass. Ran | D44 Mich. Ran | D45 Mont. Ran | D46 N.J. Ran | D47 R.I. Ran | D48 S.D. Ran | D49 W.Va. Ran | I1 |
| Majority (with Independents) ↑ | I2 | ||||||||
| R41 N.C. Ran | R42 Okla. Ran | R43 Ore. Ran | R44 S.C. Ran | R45 Tenn. Ran | R46 Texas Ran | R47 Va. Retired | R48 Wyo. (Reg) Ran | R49 Wyo. (Sp) Ran | |
| R40 N.M. Retired | R39 N.H. Ran | R38 Neb. Retired | R37 Miss. (Sp) Ran | R36 Miss. (Reg) Ran | R35 Minn. Ran | R34 Me. Ran | R33 Ky. Ran | R32 Kan. Ran | R31 Idaho Retired |
| R21 | R22 | R23 | R24 | R25 | R26 | R27 Ala. Ran | R28 Alaska Ran | R29 Colo. Retired | R30 Ga. Ran |
| R20 | R19 | R18 | R17 | R16 | R15 | R14 | R13 | R12 | R11 |
| R1 | R2 | R3 | R4 | R5 | R6 | R7 | R8 | R9 | R10 |
After the elections[edit]
| D1 | D2 | D3 | D4 | D5 | D6 | D7 | D8 | D9 | D10 |
| D20 | D19 | D18 | D17 | D16 | D15 | D14 | D13 | D12 | D11 |
| D21 | D22 | D23 | D24 | D25 | D26 | D27 | D28 | D29 | D30 |
| D40 Ill. Re-elected | D39 Del. Re-elected | D38 Ark. Re-elected | D37 | D36 | D35 | D34 | D33 | D32 | D31 |
| D41 Iowa Re-elected | D42 La. Re-elected | D43 Mass. Re-elected | D44 Mich. Re-elected | D45 Mont. Re-elected | D46 N.J. Re-elected | D47 R.I. Re-elected | D48 S.D. Re-elected | D49 W.Va. Re-elected | D50 Alaska Gain |
| Majority → | D51 Colo. Gain | ||||||||
| R41 Wyo. (Sp) Elected[d] | Vacant Minn. Disputed | I2 | I1 | D56 Va. Gain | D55 Ore. Gain | D54 N.C. Gain | D53 N.M. Gain | D52 N.H. Gain | |
| R40 Wyo. (Reg) Re-elected | R39 Texas Re-elected | R38 Tenn. Re-elected | R37 S.C. Re-elected | R36 Okla. Re-elected | R35 Neb. Hold | R34 Miss. (Sp) Elected[d] | R33 Miss. (Reg) Re-elected | R32 Me. Re-elected | R31 Ky. Re-elected |
| R21 | R22 | R23 | R24 | R25 | R26 | R27 Ala. Re-elected | R28 Ga. Re-elected | R29 Idaho Hold | R30 Kan. Re-elected |
| R20 | R19 | R18 | R17 | R16 | R15 | R14 | R13 | R12 | R11 |
| R1 | R2 | R3 | R4 | R5 | R6 | R7 | R8 | R9 | R10 |
Beginning of the first session[edit]
| D1 | D2 | D3 | D4 | D5 | D6 | D7 | D8 | D9 | D10 |
| D20 | D19 | D18 | D17 | D16 | D15 | D14 | D13 | D12 | D11 |
| D21 | D22 | D23 | D24 | D25 | D26 | D27 | D28 | D29 | D30 |
| D40 | D39 | D38 | D37 | D36 | D35 | D34 | D33 | D32 | D31 |
| D41 | D42 | D43 | D44 | D45 | D46 | D47 | D48 | D49 | D50 |
| Majority → | D51 | ||||||||
| I2 | I1 | D58 Minn. Gain | D57 Penn. Changed | D56 | D55 | D54 | D53 | D52 | |
| R40 | R39 | R38 | R37 | R36 | R35 | R34 | R33 | R32 | R31 |
| R21 | R22 | R23 | R24 | R25 | R26 | R27 | R28 | R29 | R30 |
| R20 | R19 | R18 | R17 | R16 | R15 | R14 | R13 | R12 | R11 |
| R1 | R2 | R3 | R4 | R5 | R6 | R7 | R8 | R9 | R10 |
| Key: |
|
|---|
Race summary[edit]
Special elections during the 110th Congress[edit]
In these special elections, the winner was seated during 2008 or before January 3, 2009, sorted by election date, then state, then class.
| State (linked to summaries below) | Incumbent | Results | Candidates | ||
|---|---|---|---|---|---|
| Senator | Party | Electoral history | |||
| Mississippi (Class 1) | Roger Wicker | Republican | 2007 (Appointed) | Interim appointee elected. |
|
| Wyoming (Class 1) | John Barrasso | Republican | 2007 (Appointed) | Interim appointee elected. |
|
Elections leading to the next Congress[edit]
In these general elections, the winners were elected for the term beginning January 3, 2009; ordered by state.
All of the elections involved the Class 2 seats.
| State (linked to summaries below) | Incumbent | Results | Candidates | ||
|---|---|---|---|---|---|
| Senator | Party | Electoral history | |||
| Alabama | Jeff Sessions | Republican | 1996 2002 | Incumbent re-elected. |
|
| Alaska | Ted Stevens | Republican | 1968 (Appointed) 1970 (special) 1972 1978 1984 1990 1996 2002 | Incumbent lost re-election. New senator elected. Democratic gain. |
|
| Arkansas | Mark Pryor | Democratic | 2002 | Incumbent re-elected. |
|
| Colorado | Wayne Allard | Republican | 1996 2002 | Incumbent retired. New senator elected. Democratic gain. |
|
| Delaware | Joe Biden | Democratic | 1972 1978 1984 1990 1996 2002 | Incumbent re-elected. |
|
| Georgia | Saxby Chambliss | Republican | 2002 | Incumbent re-elected. |
|
| Idaho | Larry Craig | Republican | 1990 1996 2002 | Incumbent retired. New senator elected. Republican hold. |
|
| Illinois | Dick Durbin | Democratic | 1996 2002 | Incumbent re-elected. |
|
| Iowa | Tom Harkin | Democratic | 1984 1990 1996 2002 | Incumbent re-elected. |
|
| Kansas | Pat Roberts | Republican | 1996 2002 | Incumbent re-elected. |
|
| Kentucky | Mitch McConnell | Republican | 1984 1990 1996 2002 | Incumbent re-elected. |
|
| Louisiana | Mary Landrieu | Democratic | 1996 2002 | Incumbent re-elected. |
Others
|
| Maine | Susan Collins | Republican | 1996 2002 | Incumbent re-elected. |
|
| Massachusetts | John Kerry | Democratic | 1984 1990 1996 2002 | Incumbent re-elected. |
|
| Michigan | Carl Levin | Democratic | 1978 1984 1990 1996 2002 | Incumbent re-elected. |
|
| Minnesota | Norm Coleman | Republican | 2002 | Incumbent lost re-election. New senator elected. Democratic–Farmer–Labor gain. Winner delayed term until July 7, 2009, due to election dispute. |
Others
|
| Mississippi | Thad Cochran | Republican | 1978 1984 1990 1996 2002 | Incumbent re-elected. |
|
| Montana | Max Baucus | Democratic | 1978 1984 1990 1996 2002 | Incumbent re-elected. |
|
| Nebraska | Chuck Hagel | Republican | 1996 2002 | Incumbent retired. New senator elected. Republican hold. |
|
| New Hampshire | John E. Sununu | Republican | 2002 | Incumbent lost re-election. New senator elected. Democratic gain. |
|
| New Jersey | Frank Lautenberg | Democratic | 1982 1982 (Appointed) 1988 1994 2000 (Retired) 2002 | Incumbent re-elected. |
Others
|
| New Mexico | Pete Domenici | Republican | 1972 1978 1984 1990 1996 2002 | Incumbent retired. New senator elected. Democratic gain. |
|
| North Carolina | Elizabeth Dole | Republican | 2002 | Incumbent lost re-election. New senator elected. Democratic gain. |
|
| Oklahoma | Jim Inhofe | Republican | 1994 (special) 1996 2002 | Incumbent re-elected. |
|
| Oregon | Gordon H. Smith | Republican | 1996 2002 | Incumbent lost re-election. New senator elected. Democratic gain. |
|
| Rhode Island | Jack Reed | Democratic | 1996 2002 | Incumbent re-elected. |
|
| South Carolina | Lindsey Graham | Republican | 2002 | Incumbent re-elected. |
|
| South Dakota | Tim Johnson | Democratic | 1996 2002 | Incumbent re-elected. |
|
| Tennessee | Lamar Alexander | Republican | 2002 | Incumbent re-elected. |
Others
|
| Texas | John Cornyn | Republican | 2002 2002 (Appointed) | Incumbent re-elected. |
|
| Virginia | John Warner | Republican | 1978 1984 1990 1996 2002 | Incumbent retired. New senator elected. Democratic gain. |
|
| West Virginia | Jay Rockefeller | Democratic | 1984 1990 1996 2002 | Incumbent re-elected. |
|
| Wyoming | Mike Enzi | Republican | 1996 2002 | Incumbent re-elected. |
|
Special elections during the next Congress[edit]
There were no special elections in 2009.
Closest races[edit]
In nine races the margin of victory was under 10%. However, Georgia proceeded to a runoff election where the Republican candidate won by over 10%.
| District | Winner | Margin |
|---|---|---|
| Minnesota | Democratic (flip) | 0.01% |
| Alaska | Democratic (flip) | 1.3% |
| Oregon | Democratic (flip) | 3.6% |
| Georgia general | Republican | 3.0% |
| Kentucky | Republican | 6.0% |
| New Hampshire | Democratic (flip) | 6.3% |
| Louisiana | Democratic | 6.4% |
| North Carolina | Democratic (flip) | 8.5% |
| Mississippi special | Republican | 9.9% |
South Dakota was the tipping point state, decided by a margin of 25.0%.
Final pre-election predictions[edit]
Several sites and individuals published predictions of competitive seats. These predictions looked at factors such as the strength of the incumbent (if the incumbent was running for re-election) and the other candidates, and the state's partisan lean (reflected in part by the state's Cook Partisan Voting Index rating). The predictions assigned ratings to each seat, indicating the predicted advantage that a party had in winning that seat. Most election predictors used:
- "tossup": no advantage
- "tilt" (used by some predictors): advantage that is not quite as strong as "lean"
- "lean": slight advantage
- "likely": significant, but surmountable, advantage
- "safe" or "solid": near-certain chance of victory
| Constituency | Incumbent | 2008 election ratings | ||||||||||||
|---|---|---|---|---|---|---|---|---|---|---|---|---|---|---|
| State | Senator | Last election[e] | The Cook Political Report[5] | CQ Politics[6] | Rothenberg Political Report[7] | Real Clear Politics[8] | Result | |||||||
| Alabama | Jeff Sessions | 58.6% R | Safe R | Safe R | Safe R | Safe R | Sessions (63.4%) | |||||||
| Alaska | Ted Stevens | 78.2% R | Lean D (flip) | Lean D (flip) | Lean D (flip) | Lean D (flip) | Begich (47.8%)(flip) | |||||||
| Arkansas | Mark Pryor | 53.9% D | Safe D | Safe D | Safe D | Safe D | Pryor (79.5%) | |||||||
| Colorado | Wayne Allard (retiring) | 50.7% R | Lean D (flip) | Likely D (flip) | Likely D (flip) | Likely D (flip) | Udall (52.8%) (flip) | |||||||
| Delaware | Joe Biden | 58.2% D | Safe D | Safe D | Safe D | Safe D | Biden (64.7%) | |||||||
| Georgia | Saxby Chambliss | 52.8% R | Tossup | Tossup | Lean R | Tossup | Chambliss (57.4%)[f] | |||||||
| Idaho | Larry Craig (retiring) | 65.2% R | Safe R | Safe R | Safe R | Safe R | Risch (57.7%) | |||||||
| Illinois | Dick Durbin | 60.3% D | Safe D | Safe D | Safe D | Safe D | Durbin (67.8%) | |||||||
| Iowa | Tom Harkin | 54.2% D | Safe D | Safe D | Safe D | Safe D | Harkin (62.7%) | |||||||
| Kansas | Pat Roberts | 82.5% R | Safe R | Likely R | Safe R | Safe R | Roberts (60.1%) | |||||||
| Kentucky | Mitch McConnell | 64.7% R | Lean R | Lean R | Lean R | Tossup | McConnell (53.0%) | |||||||
| Louisiana | Mary Landrieu | 51.7% D | Lean D | Lean D | Lean D | Lean D | Landrieu (52.1%) | |||||||
| Maine | Susan Collins | 58.4% R | Likely R | Lean R | Likely R | Likely R | Collins (61.3%) | |||||||
| Massachusetts | John Kerry | 80.0% D | Safe D | Safe D | Safe D | Safe D | Kerry (65.9%) | |||||||
| Michigan | Carl Levin | 60.6% D | Safe D | Safe D | Safe D | Safe D | Levin (62.7%) | |||||||
| Minnesota | Norm Coleman | 49.5% R | Tossup | Tossup | Tossup | Tossup | Franken (42.0%)(flip) | |||||||
| Mississippi (regular) | Thad Cochran | 84.6% R | Safe R | Safe R | Safe R | Safe R | Cochran (61.4%) | |||||||
| Mississippi (special) | Roger Wicker | Appointed (2007)[g] | Tossup | Lean R | Lean R | Lean R | Wicker n (55.0%) | |||||||
| Montana | Max Baucus | 62.7% D | Safe D | Safe D | Safe D | Safe D | Baucus (72.9%) | |||||||
| Nebraska | Chuck Hagel (retiring) | 82.8% R | Likely R | Likely R | Safe R | Likely R | Johanns (57.5%) | |||||||
| New Hampshire | John Sununu | 50.8% R | Tossup | Lean D (flip) | Likely D (flip) | Lean D (flip) | Shaheen (51.6%)(flip) | |||||||
| New Jersey | Frank Lautenberg | 53.9% D | Safe D | Likely D | Safe D | Likely D | Lautenberg (56.0%) | |||||||
| New Mexico | Pete Domenici (retiring) | 65.0% R | Lean D (flip) | Likely D (flip) | Likely D (flip) | Likely D (flip) | Udall (61.3%)(flip) | |||||||
| North Carolina | Elizabeth Dole | 53.5% R | Tossup | Lean D (flip) | Lean D (flip) | Tossup | Hagan (52.6%)(flip) | |||||||
| Oklahoma | Jim Inhofe | 57.3% R | Likely R | Likely R | Safe R | Safe R | Inhofe (56.7%) | |||||||
| Oregon | Gordon Smith | 56.2% R | Tossup | Tossup | Lean D (flip) | Tossup | Merkley (48.9%)(flip) | |||||||
| Rhode Island | Jack Reed | 78.4% D | Safe D | Safe D | Safe D | Safe D | Reed (73.4%) | |||||||
| South Carolina | Lindsey Graham | 54.4% R | Safe R | Safe R | Safe R | Safe R | Graham (57.5%) | |||||||
| South Dakota | Tim Johnson | 49.6% D | Likely D | Safe D | Safe D | Safe D | Johnson (62.5%) | |||||||
| Tennessee | Lamar Alexander | 54.3% R | Safe R | Likely R | Safe R | Safe R | Alexander (65.1%) | |||||||
| Texas | John Cornyn | 55.3% R | Safe R | Likely R | Safe R | Safe R | Cornyn (54.8%) | |||||||
| Virginia | John Warner (retiring) | 82.6% R | Likely D (flip) | Safe D (flip) | Likely D (flip) | Safe D (flip) | Mark Warner (65.0%)(flip) | |||||||
| West Virginia | Jay Rockefeller | 63.1% D | Safe D | Safe D | Safe D | Safe D | Rockefeller (63.7%) | |||||||
| Wyoming (regular) | Mike Enzi | 73.0% R | Safe R | Safe R | Safe R | Safe R | Enzi (75.6%) | |||||||
| Wyoming (special) | John Barrasso | Appointed (2007)[h] | Safe R | Safe R | Safe R | Safe R | Barrasso (73.4%) | |||||||
Financing[edit]

Each major party has Hill committees that work to support its candidates for the House and Senate, chiefly by providing funds. On the Senate side, the committees are the Democratic Senatorial Campaign Committee (DSCC) and the National Republican Senatorial Committee (NRSC). In this cycle, the DSCC was more successful at fundraising. As of June 30, 2008, data from the Federal Election Commission showed the NRSC with $24.6 million on hand, as compared with the DSCC's $43 million.[9] The NRSC chair, senator John Ensign, took the unusual step of chastising the Republican Senators who, like him, were not facing re-election, and who he thought should have done more to help raise money for their colleagues.[9]
Gains and losses[edit]
Retirements[edit]
Five Republicans retired rather than seek re-election.
| State | Senator | Replaced by |
|---|---|---|
| Colorado | Wayne Allard | Mark Udall |
| Idaho | Larry Craig | Jim Risch |
| Nebraska | Chuck Hagel | Mike Johanns |
| New Mexico | Pete Domenici | Tom Udall |
| Virginia | John Warner | Mark Warner |
Defeats[edit]
Five Republicans sought re-election but lost in the general election.
Post-election changes[edit]
Four Democrats resigned and were replaced by Democrats. One Republican was switched to Democrat on April 28, 2009. Two other Democrats died on August 25, 2009, and June 28, 2010, respectively, while another Republican resigned on September 9, 2009.
| State | Senator | Replaced by |
|---|---|---|
| Colorado (Class 3) | Ken Salazar | Michael Bennet |
| Delaware (Class 2) | Joe Biden | Ted Kaufman |
| Florida (Class 3) | Mel Martínez | George LeMieux |
| Illinois (Class 3) | Barack Obama | Roland Burris |
| Massachusetts (Class 1) | Ted Kennedy | Paul G. Kirk |
| New York (Class 1) | Hillary Clinton | Kirsten Gillibrand |
| Pennsylvania (Class 3) | Arlen Specter | Arlen Specter |
| West Virginia (Class 1) | Robert Byrd | Carte Goodwin |
Alabama[edit]
| |||||||||||||||||
 Sessions: 50–60% 60–70% 70–80% 80–90% Figures: 50–60% 60–70% 70–80% 80–90% | |||||||||||||||||
| |||||||||||||||||


Alabama senator Jeff Sessions sought re-election to a third term. Johnny Swanson announced his candidacy in March 2006 for the Democratic nomination.[10]
Despite voting heavily for Bush in 2004, Alabama still had a strong Democratic presence; Democrats controlled majorities of both chambers in the state legislature. Commissioner of Agriculture and Industries Ron Sparks appeared to be preparing for a run, but on June 12, 2007, Sparks announced that he would not seek the Senate seat, in order to avoid a primary battle with state senator Vivian Davis Figures.[11] Figures has won elections in the Republican-leaning Mobile area. In the Democratic primary, Figures won the nomination and face Sessions in November.
Not on the ballot, but running a write-in campaign, was Darryl W. Perry, the 2004 Libertarian Party nominee for Pennsylvania State Treasurer and 2007 candidate for Mayor of Birmingham, Alabama.[12][13] Perry was endorsed by Alabama Statesmen,[14] Boston Tea Party,[15] and Christians for Life and Liberty.[16]
Sessions defeated Figures, taking 63% of the vote to Figures's 37%
| Party | Candidate | Votes | % | |
|---|---|---|---|---|
| Republican | Jeff Sessions (incumbent) | 199,690 | 92.27% | |
| Republican | Earl Mack Gavin | 16,718 | 7.73% | |
| Total votes | 216,408 | 100.00% | ||
| Party | Candidate | Votes | % | |
|---|---|---|---|---|
| Democratic | Vivian Davis Figures | 112,074 | 63.72% | |
| Democratic | Johnny Swanson | 38,757 | 22.03% | |
| Democratic | Mark Townsend | 25,058 | 14.25% | |
| Total votes | 175,889 | 100.00% | ||
| Party | Candidate | Votes | % | |
|---|---|---|---|---|
| Republican | Jeff Sessions (Incumbent) | 1,305,383 | 63.36% | |
| Democratic | Vivian Davis Figures | 752,391 | 36.52% | |
| Write-In | Write-ins | 2,417 | 0.12% | |
| Invalid or blank votes | ||||
| Total votes | 2,060,191 | 100.00% | ||
| Turnout | {{{votes}}} | N/A | ||
| Republican hold | ||||
Alaska[edit]
| |||||||||||||||||
 Borough and census area results Begich: 40–50% 50–60% 60–70% Stevens: 40–50% 50–60% 60–70% | |||||||||||||||||
| |||||||||||||||||

.jpg)
| Party | Candidate | Votes | % | |
|---|---|---|---|---|
| Democratic | Mark Begich | 63,747 | 84.12% | |
| Democratic | Ray Metcalfe | 5,480 | 7.23% | |
| Independence | Bob Bird | 4,216 | 5.56% | |
| Libertarian | Fredrick Haase | 1,375 | 1.81% | |
| Democratic | Frank Vondersaar | 965 | 1.27% | |
| Total votes | 75,783 | 100.00% | ||
| Party | Candidate | Votes | % | |
|---|---|---|---|---|
| Republican | Ted Stevens (incumbent) | 66,900 | 63.52% | |
| Republican | David Cuddy | 28,364 | 26.93% | |
| Republican | Vic Vickers | 6,102 | 5.79% | |
| Republican | Michael Corey | 1,496 | 1.42% | |
| Republican | Roderic Sikma | 1,133 | 1.08% | |
| Republican | Rich Wanda | 732 | 0.69% | |
| Republican | Gerald Heikes | 599 | 0.57% | |
| Total votes | 105,326 | 100.00% | ||
| Party | Candidate | Votes | % | ±% | |
|---|---|---|---|---|---|
| Democratic | Mark Begich | 151,767 | 47.77% | +37.26% | |
| Republican | Ted Stevens (Incumbent) | 147,814 | 46.52% | -31.65% | |
| Independence | Bob Bird | 13,197 | 4.15% | +1.22% | |
| Libertarian | Fredrick Haase | 2,483 | 0.78% | -0.25% | |
| Independent | Ted Gianoutsos | 1,385 | 0.44% | ||
| Write-ins | 1,077 | 0.34% | |||
| Majority | 3,953 | 1.24% | -66.42% | ||
| Turnout | 317,723 | ||||
| Democratic gain from Republican | Swing | ||||
Dispelling rumors that he would retire due to advanced age (he was 84 years old on election day) and ongoing federal investigations into his conduct, senator Ted Stevens filed papers for re-election for an eighth term.[22]
An ex-oil company executive, Bill Allen, paid for part of the renovation costs on Stevens's personal residence. The FBI investigated the remodeling of Stevens home by Veco Corp., which is part of a broader corruption investigation involving Stevens's son, former State Senate President Ben Stevens.[23] Two former Veco executives have pleaded guilty to paying the younger Stevens $242,000 in bribes.[24] On July 30, 2007, the IRS and FBI raided Stevens's home in Alaska. On September 14, 2007, former Veco CEO Bill Allen testified at the trial of former State House Speaker Pete Kott that Veco paid people working to double the size of Stevens's home.[25]
On July 29, 2008, a federal grand jury indicted Stevens on seven felony counts for making false statements,[26] and on October 26, a jury found Stevens guilty on all charges.[27]
The Democratic candidate was Anchorage Mayor Mark Begich, the son of popular former Democratic Representative Nick Begich. Begich announced his candidacy for the Senate seat on April 22, 2008.[28]
On October 19, 2007, the AP reported that despite the allegations and FBI probe, several veteran GOP Senators—including Orrin Hatch (R-UT), Kay Bailey Hutchison (R-TX), and Kit Bond (R-MO)—donated enough money to Stevens's re-election campaign to make it one of Stevens's most successful fund raising quarters ever.[29]
Stevens's conviction on seven felony counts of corruption damaged his re-election bid, coming just over a week before the election, though Stevens appealed the conviction. Nevertheless, Stevens was narrowly ahead in the vote count after election day, with only about two-thirds of all votes counted. It only became clear Begich had prevailed when early votes, absentee ballots, and questioned ballots were counted.
On November 18, the race was called for Begich, who won with 47.8% to Stevens's 46.5%. Stevens was the most senior U.S. Senator to ever lose re-election, defeating Warren Magnuson's 1980 record. As of 2023, Stevens still holds this record.
On April 1, 2009, U.S. Attorney General Eric Holder, citing serious prosecutorial misconduct during the trial, decided to drop all charges against Stevens—an action that vacated his conviction.[citation needed]
Arkansas[edit]
| |||||||||||||||||
 County results Pryor: 60–70% 70–80% 80–90% | |||||||||||||||||
| |||||||||||||||||


| Party | Candidate | Votes | % | |
|---|---|---|---|---|
| Democratic | Mark Pryor (Incumbent) | 804,678 | 79.53% | |
| Green | Rebekah Kennedy | 207,076 | 20.47% | |
| Total votes | 1,011,754 | 100.00% | ||
| Invalid or blank votes | 75,586 | n/a | ||
| Democratic hold | ||||
Despite being a first-term senator in a state George W. Bush won twice, Democrat Mark Pryor faced no opposition from Republicans in his re-election bid. Although Bush carried the state twice, Arkansas Democrats swept the seven state races held in the 2006 general election. Pryor is the son of longtime U.S. senator and former Arkansas Governor David Pryor. It was rumored that Lt. Governor Bill Halter would challenge Pryor in the primary, but Halter declined to file as a candidate.[31] Rebekah Kennedy of the Green Party was Pryor's only opposition. Pryor won on election day, with 79.53% of the vote. Kennedy took 20.47%.
Colorado[edit]
| |||||||||||||||||
 Udall: 40–50% 50–60% 60–70% 70–80% Schaffer: 40–50% 50–60% 60–70% 70–80% | |||||||||||||||||
| |||||||||||||||||


| Party | Candidate | Votes | % | |
|---|---|---|---|---|
| Democratic | Mark Udall | 194,227 | 100.00% | |
| Total votes | 194,227 | 100.00% | ||
| Party | Candidate | Votes | % | |
|---|---|---|---|---|
| Republican | Bob Schaffer | 239,212 | 100.00% | |
| Total votes | 239,212 | 100.00% | ||
| Party | Candidate | Votes | % | ±% | |
|---|---|---|---|---|---|
| Democratic | Mark Udall | 1,230,994 | 52.80% | +7.03% | |
| Republican | Bob Schaffer | 990,755 | 42.49% | -8.20% | |
| Constitution | Douglas Campbell | 59,733 | 2.56% | +1.04% | |
| Green | Bob Kinsey | 50,004 | 2.14% | ||
| Write-ins | 135 | 0.01% | |||
| Majority | 240,239 | 10.30% | +5.38% | ||
| Turnout | 2,331,621 | ||||
| Democratic gain from Republican | Swing | ||||
On January 15, 2007, incumbent senator Wayne Allard (R) announced he would not seek re-election, honoring his pledge to serve no more than two terms.[34]
Former Representative Bob Schaffer of Fort Collins was the Republican nominee. Former Denver Broncos quarterback John Elway was rumored to be considering a run, but declined to do so.[35] Other possible Republican candidates included former Congressman Scott McInnis and Colorado Attorney General John Suthers.
The Democratic nominee was 2nd district Congressman Mark Udall of Boulder who announced on January 15, 2007, that he would seek the seat and did not draw significant primary opposition.[36]
Other candidates included Bob Kinsey of Denver as the Green Party nominee,[37] Douglas "Dayhorse" Campbell as the American Constitution Party's nominee,[38] and Independent candidate Buddy Moore, unaffiliated any party.[39]
On Election Day, Udall defeated Schaffer 53% to 43%.
Delaware[edit]
| |||||||||||||||||
 Biden: 50–60% 70–80% | |||||||||||||||||
| |||||||||||||||||


| Party | Candidate | Votes | % | ±% | |
|---|---|---|---|---|---|
| Democratic | Joe Biden (Incumbent) | 257,539 | 64.69% | +6.47% | |
| Republican | Christine O'Donnell | 140,595 | 35.31% | -5.49% | |
| Majority | 116,944 | 29.37% | +11.96% | ||
| Turnout | 398,134 | ||||
| Democratic hold | Swing | ||||
On August 23, 2008, the Democratic nominee for President, Barack Obama, announced that Biden would be joining him on the ticket as the vice presidential nominee.[41] Delaware law allowed Biden to run for Vice President and senator at the same time, so he would have kept the Senate seat if the presidential ticket had lost. In 1988 and 2000, the Democratic Vice-Presidential nominees Lloyd Bentsen and Joe Lieberman, ran similarly for their seat in Texas and Connecticut, respectively. On November 4, 2008, Barack Obama won the presidential election, making Biden the next VP. Biden vacated his senate seat shortly after the election, allowing for the Governor of Delaware to appoint a successor. There was speculation as to whether the outgoing Governor, Ruth Ann Minner, or the incoming Governor-elect Jack Markell would make the appointment, and if Biden's son, Delaware Attorney General Beau Biden would receive the appointment. On November 24, 2008, Governor Minner appointed Biden's longtime Chief of Staff Ted Kaufman to fill the seat. Kaufman subsequently announced that he would not seek election to a full term in 2010, effectively making him a caretaker. Biden's Republican opponent in the Senate race, conservative political commentator Christine O'Donnell, tried to make an issue of Biden's dual campaigns, claiming that serving his constituents is not important to him.
Biden was re-elected with 65% of the vote, or 257,484 votes. O'Donnell received 140,584 votes (35% of the vote).
Georgia[edit]
| |||||||||||||||||
| |||||||||||||||||
  Chambliss: 40–50% 50–60% 60–70% 70–80% 80–90% Martin: 40-50% 50–60% 60–70% 70–80% 80–90% Tie: 40–50% | |||||||||||||||||
| |||||||||||||||||


| Party | Candidate | Votes | % | |
|---|---|---|---|---|
| Republican | Saxby Chambliss | 392,902 | 100.0% | |
| Turnout | 392,928 | 100.0% | ||
| Party | Candidate | Votes | % | |
|---|---|---|---|---|
| Democratic | Vernon Jones | 199,026 | 40.4% | |
| Democratic | Jim Martin | 169,635 | 34.4% | |
| Democratic | Dale Cardwell | 79,181 | 16.1% | |
| Democratic | Rand Knight | 25,667 | 5.2% | |
| Democratic | Josh Lanier | 19,717 | 4.0% | |
| Total votes | 493,226 | 100.0% | ||
| Party | Candidate | Votes | % | ±% | |
|---|---|---|---|---|---|
| Democratic | Jim Martin | 191,061 | 59.9% | +25.5% | |
| Democratic | Vernon Jones | 127,993 | 40.1% | -0.3% | |
| Total votes | 319,054 | 100.0% | |||
| Party | Candidate | Votes | % | ±% | |
|---|---|---|---|---|---|
| Republican | Saxby Chambliss (Incumbent) | 1,867,097 | 49.8% | -3.0% | |
| Democratic | Jim Martin | 1,757,393 | 46.8% | +0.9% | |
| Libertarian | Allen Buckley | 127,923 | 3.4% | +2.1% | |
| Socialist Workers | Eleanor Garcia (write-in) | 43 | 0.0% | n/a | |
| Independent | William Salomone Jr. (write-in) | 29 | 0.0% | n/a | |
| Majority | 109,704 | 2.92% | |||
| Turnout | 3,752,577 | ||||
| Party | Candidate | Votes | % | ±% | |
|---|---|---|---|---|---|
| Republican | Saxby Chambliss (Incumbent) | 1,228,033 | 57.4% | +7.6% | |
| Democratic | Jim Martin | 909,923 | 42.6% | -4.2% | |
| Majority | 318,110 | 14.8% | |||
| Turnout | 2,137,956 | ||||
| Republican hold | Swing | ||||
In the 2008 election, first-term incumbent Republican senator Saxby Chambliss was opposed primarily by Democrat Jim Martin, as well as third party candidates, including Libertarian Allen Buckley and Eleanor Garcia of the Socialist Workers Party.
Martin, current Georgia Commissioner of Human Resources, former member of the Georgia General Assembly, Vietnam War veteran, and 2006 candidate for lieutenant governor, secured the Democratic nomination after defeating DeKalb County CEO Vernon Jones by a 59% to 41% margin in the August 5 run-off election.
In December 2007, Chambliss had an approval rating of 53% and a disapproval rating of 34% according to Strategic Vision, a Republican polling firm.[45] For most of the campaign, Chambliss maintained a comfortable lead in most polls. However, in the weeks leading up to the 2008 general election, polls showed the race tightening, reflecting a general nationwide trend.
On November 4, 2008, Chambliss received 49.8% of the vote,[46] with Martin about 3% behind and Buckley receiving 3% of the vote.[47] However, Georgia law stated that if no candidate receives a simple majority of the popular vote, then the election will be decided in a run-off. On December 2, 2008, Chambliss won the run-off with 57% of vote to Martin's 43%.[48]
Idaho[edit]
| |||||||||||||||||||||||||||||||||||||
 County results Risch: 50–60% 60–70% 70–80% LaRocco: 40–50% 50–60% | |||||||||||||||||||||||||||||||||||||
| |||||||||||||||||||||||||||||||||||||


| Party | Candidate | Votes | % | |
|---|---|---|---|---|
| Democratic | Larry LaRocco | 29,023 | 72.35% | |
| Democratic | David J. Archuleta | 11,074 | 27.60% | |
| Democratic | Write-ins | 20 | 0.05% | |
| Total votes | 40,117 | 100.00% | ||
| Party | Candidate | Votes | % | |
|---|---|---|---|---|
| Republican | Jim Risch | 80,743 | 65.34% | |
| Republican | Scott Syme | 16,660 | 13.48% | |
| Republican | Richard Phenneger | 6,532 | 5.29% | |
| Republican | Neal Thompson | 5,375 | 4.35% | |
| Republican | Fred M. Adams | 4,987 | 4.04% | |
| Republican | Bill Hunter | 4,280 | 3.46% | |
| Republican | Brian E. Hefner | 2,915 | 2.36% | |
| Republican | Hal James Styles Jr. | 2,082 | 1.68% | |
| Total votes | 123,574 | 100.00% | ||
| Party | Candidate | Votes | % | ±% | |
|---|---|---|---|---|---|
| Republican | Jim Risch | 371,744 | 57.65% | -7.51% | |
| Democratic | Larry LaRocco | 219,903 | 34.11% | +1.56% | |
| Independent | Rex Rammell | 34,510 | 5.35% | ||
| Libertarian | Kent Marmon | 9,958 | 1.54% | -0.75% | |
| Independent | Pro-Life | 8,662 | 1.35% | ||
| Write-ins | 3 | 0.00% | |||
| Majority | 151,841 | 23.55% | -9.06% | ||
| Turnout | 644,780 | ||||
| Republican hold | Swing | ||||
On September 1, 2007, senator Larry Craig announced his intent to resign from the Senate effective September 30, 2007.[51] The announcement followed by just six days the disclosure that he had pleaded guilty on August 1, 2007, to a reduced misdemeanor charge arising out of his arrest on June 11 at the Minneapolis airport for soliciting sex with a man in the restroom. Craig found almost no support among Republicans in his home state or Washington. On October 4, 2007, senator Craig announced he will not seek re-election, but would remain in office until the end of his term.[52]
Lieutenant Governor Jim Risch was the Republican candidate; U.S. Army veteran and former congressman Larry LaRocco was the Democratic candidate.[53] Risch and LaRocco ran against each other in the 2006 Lieutenant Governor race, which Risch won by a wide margin. Libertarian Kent Marmon also ran.[54] The last Democratic senator from Idaho was Frank Church, who was defeated in the Republican landslide of 1980 after serving four terms.
Risch won the election with approximately 58% of the vote.[55]
Illinois[edit]
| |||||||||||||||||
 County results Durbin: 40–50% 50–60% 60–70% 70–80% Sauerberg: 40–50% 50–60% | |||||||||||||||||
| |||||||||||||||||

| Party | Candidate | Votes | % | |
|---|---|---|---|---|
| Democratic | Dick Durbin (Incumbent) | 1,653,833 | 100.00% | |
| Total votes | 1,653,833 | 100.00% | ||
| Party | Candidate | Votes | % | |
|---|---|---|---|---|
| Republican | Steve Sauerberg | 395,199 | 55.62% | |
| Republican | Andy Martin | 240,548 | 33.85% | |
| Republican | Mike Psak | 74,829 | 10.53% | |
| Total votes | 710,576 | 100.00% | ||
| Party | Candidate | Votes | % | ±% | |
|---|---|---|---|---|---|
| Democratic | Dick Durbin (Incumbent) | 3,615,844 | 67.84% | +7.51% | |
| Republican | Steve Sauerberg | 1,520,621 | 28.53% | -9.49% | |
| Green | Kathy Cummings | 119,135 | 2.24% | 0.00% | |
| Libertarian | Larry A. Stafford | 50,224 | 0.94% | -0.70% | |
| Constitution | Chad N. Koppie | 24,059 | 0.45% | 0.00% | |
| Majority | 2,095,223 | 39.31% | +17.00% | ||
| Turnout | 5,329,884 | ||||
| Democratic hold | Swing | ||||
Senate Majority Whip Richard Durbin remained favored in Illinois. He sought to be re-elected in a state that has steadily become more Democratic since 1992. CQpolitics.com rated the contest as "safe Democrat".
Physician Steve Sauerberg of La Grange won the February 5 Republican primary.[57] Kathy Cummings, a retired special education teacher was nominated via convention by the Green Party.[58] Chad Koppie, a retired airline pilot and vice-chairman of the Illinois Center Right Coalition, was the nominee of the Constitution Party.
Durbin won with 68% of the vote. Sauerberg had 29%.
Iowa[edit]
| |||||||||||||||||
 County results Harkin: 50–60% 60–70% 70–80% Reed: 50–60% 60–70% 70–80% | |||||||||||||||||
| |||||||||||||||||
.jpg)
.jpg)
| Party | Candidate | Votes | % | |
|---|---|---|---|---|
| Democratic | Tom Harkin (Incumbent) | 90,785 | 98.83% | |
| Democratic | Write-ins | 1,074 | 1.17% | |
| Total votes | 91,859 | 100.00% | ||
| Party | Candidate | Votes | % | |
|---|---|---|---|---|
| Republican | Christopher Reed | 24,964 | 35.32% | |
| Republican | George Eichhorn | 24,390 | 34.52% | |
| Republican | Steve Rathje | 21,062 | 29.80% | |
| Republican | Write-ins | 256 | 0.36% | |
| Total votes | 70,672 | 100.00% | ||
| Party | Candidate | Votes | % | ±% | |
|---|---|---|---|---|---|
| Democratic | Tom Harkin (Incumbent) | 941,665 | 62.66% | +8.48% | |
| Republican | Christopher Reed | 560,006 | 37.26% | -6.52% | |
| Write-ins | 1,247 | 0.08% | |||
| Majority | 381,659 | 25.39% | +15.00% | ||
| Turnout | 1,502,918 | ||||
| Democratic hold | Swing | ||||
In a state that had been trending to the Democratic party recently, senator Tom Harkin faced the Republican nominee, small business owner Christopher Reed, whom he defeated with 63% of the vote to Reed's 37%.
Kansas[edit]
| |||||||||||||||||
 County results Roberts: 40–50% 50–60% 60–70% 70–80% 80–90% >90% Slattery: 40–50% 50–60% 60–70% | |||||||||||||||||
| |||||||||||||||||


| Party | Candidate | Votes | % | |
|---|---|---|---|---|
| Republican | Pat Roberts (Incumbent) | 214,911 | 100.00% | |
| Total votes | 214,911 | 100.00% | ||
| Party | Candidate | Votes | % | |
|---|---|---|---|---|
| Democratic | Jim Slattery | 68,106 | 68.93% | |
| Democratic | Lee Jones | 30,699 | 31.07% | |
| Total votes | 98,805 | 100.00% | ||
| Party | Candidate | Votes | % | ±% | |
|---|---|---|---|---|---|
| Republican | Pat Roberts (Incumbent) | 727,121 | 60.06% | -22.46% | |
| Democratic | Jim Slattery | 441,399 | 36.46% | ||
| Libertarian | Randall Hodgkinson | 25,727 | 2.12% | -6.98% | |
| Reform | Joseph L. Martin | 16,443 | 1.36% | -7.02% | |
| Majority | 285,722 | 23.60% | -49.82% | ||
| Turnout | 1,210,690 | ||||
| Republican hold | Swing | ||||
Senator Pat Roberts sought re-election to a third term. Although Kansas has not elected a Democrat to the Senate since 1932, former Democratic Congressman and army veteran Jim Slattery was nominated to run against Roberts. Pat Roberts currently has an approval rating of 56%.[62]
Roberts was re-elected with 60% to Slattery's 36%.
Kentucky[edit]
| |||||||||||||||||
 County results McConnell: 50–60% 60–70% 70–80% Lunsford: 50–60% 60–70% 70–80% | |||||||||||||||||
| |||||||||||||||||

.jpg)
| Party | Candidate | Votes | % | |
|---|---|---|---|---|
| Republican | Mitch McConnell (incumbent) | 168,127 | 86.09% | |
| Republican | Daniel Essek | 27,170 | 13.91% | |
| Total votes | 195,297 | 100.00% | ||
| Party | Candidate | Votes | % | |
|---|---|---|---|---|
| Democratic | Bruce Lunsford | 316,992 | 51.15% | |
| Democratic | Greg Fischer | 209,827 | 33.85% | |
| Democratic | David L. Williams | 34,363 | 5.54% | |
| Democratic | Michael Cassaro | 17,340 | 2.80% | |
| Democratic | Kenneth Stepp | 13,451 | 2.17% | |
| Democratic | David Wylie | 7,528 | 1.21% | |
| Democratic | James E. Rice | 2,365 | 3.28% | |
| Total votes | 619,904 | 100.00% | ||
| Party | Candidate | Votes | % | ±% | |
|---|---|---|---|---|---|
| Republican | Mitch McConnell (incumbent) | 953,816 | 52.97% | -11.7% | |
| Democratic | Bruce Lunsford | 847,005 | 47.03% | +11.7% | |
| Turnout | 1,800,821 | 62.00% | +19.2% | ||
| Republican hold | Swing | ||||
Democrats made Senate Minority Leader, four-term senator Mitch McConnell of Kentucky a target due to his leadership of Senate Republicans and his ties to President Bush, as well as his mediocre approval rating in the state, which was below 50%.[65]
Businessman and U.S. Army veteran Bruce Lunsford, who lost the 2007 Democratic gubernatorial primary to Governor Steve Beshear, was the Democratic nominee.
Once thought to be secure in his re-election, McConnell's lead had shrunk dramatically thanks to the financial crisis and polling showed the race tightening between him and Lunsford.[66] Nevertheless, McConnell was re-elected by a margin of 53% to 47%.
Louisiana[edit]
| |||||||||||||||||
 Landrieu: 40-50% 50–60% 60–70% 80–90% Kennedy: 40–50% 50–60% 60–70% 70–80% | |||||||||||||||||
| |||||||||||||||||


| Party | Candidate | Votes | % | ±% | |
|---|---|---|---|---|---|
| Democratic | Mary Landrieu (Incumbent) | 988,298 | 52.11% | +0.41% | |
| Republican | John Neely Kennedy | 867,177 | 45.72% | -2.58% | |
| Libertarian | Richard Fontanesi | 18,590 | 0.98% | n/a | |
| Independent | Jay Patel | 13,729 | 0.72% | n/a | |
| Independent | Robert Stewart | 8,780 | 0.46% | n/a | |
| Majority | 121,121 | 6.39% | +2.99% | ||
| Turnout | 1,896,574 | 100.0% | |||
| Democratic hold | Swing | ||||
Incumbent Mary Landrieu was elected in 1996 following a recount and was narrowly re-elected in 2002 in a runoff election. Since those elections, Democrats have had to endure the loss of some reliable voters because Hurricane Katrina dispersed many African-Americans from New Orleans, although the vast majority still live within Louisiana. The state has become more Republican over the past 12 years. Louisiana elected David Vitter in 2004, the state's first Republican senator since Reconstruction, as well as Republican Bobby Jindal as the first Indian-American Governor in the country's history in 2007. Louisiana's electoral votes easily went to George W. Bush in 2000 and 2004.
On August 27, 2007, state Treasurer John Neely Kennedy announced he was switching parties from Democrat to Republican. On November 29, after being personally recruited by Vitter and former Bush administration official Karl Rove, Kennedy announced plans to challenge Landrieu in 2008.[67][68]
In the end, Landrieu was re-elected with 52% of the vote, Kennedy having 46%.
Maine[edit]
| |||||||||||||||||
  Collins: 50–60% 60–70% 70–80% 80–90% >90% Allen: 50–60% 60–70% | |||||||||||||||||
| |||||||||||||||||


| Party | Candidate | Votes | % | ±% | |
|---|---|---|---|---|---|
| Democratic | Tom Allen | 69,932 | 85.6% | ||
| Democratic | Tom Ledue | 11,795 | 14.4% | ||
| Turnout | 81,727 | ||||
| Party | Candidate | Votes | % | ±% | |
|---|---|---|---|---|---|
| Republican | Susan Collins (incumbent) | 444,300 | 61.33% | +2.9% | |
| Democratic | Tom Allen | 279,510 | 38.58% | -3.0% | |
| write-ins | 620 | 0.09% | n/a | ||
| Majority | 164,790 | ||||
| Turnout | 724,430 | ||||
| Republican hold | Swing | ||||
In Maine, Susan Collins sought a third term in the Senate. She has maintained a high approval rating, and also in her favor is the landslide re-election of Maine's senior Senator, Olympia Snowe, who had the largest margin of victory of any GOP Senate candidate - besides the largely unopposed Richard Lugar (R-IN) - in the 2006 election cycle. Collins was re-elected with 58% of the vote in 2002 over State Sen. Chellie Pingree. Fellow senator Joe Lieberman, citing his status as an independent, endorsed Collins in her 2008 re-election bid.
On May 8, 2007, Rep. Tom Allen (ME-1) announced his candidacy on his website Archived May 10, 2007, at the Wayback Machine. He had already expressed interest in running and had been building the apparatus necessary to wage a Senate campaign.[69]
Collins won on election day with 61% of the vote, compared to 39% for Allen.
Massachusetts[edit]
| |||||||||||||||||
 
| |||||||||||||||||
| |||||||||||||||||


| Party | Candidate | Votes | % | ±% | |
|---|---|---|---|---|---|
| Democratic | John Kerry (incumbent) | 335,923 | 68.92% | ||
| Democratic | Edward O'Reilly | 151,473 | 31.08% | ||
| Turnout | 487,396 | ||||
| Party | Candidate | Votes | % | ±% | |
|---|---|---|---|---|---|
| Democratic | John Kerry (Incumbent) | 1,959,843 | 65.82% | -14.2% | |
| Republican | Jeff Beatty | 922,727 | 30.99% | +30.99% | |
| Libertarian | Robert J. Underwood | 94,727 | 3.18% | -15.1% | |
| Majority | 1,037,116 | ||||
| Turnout | 2,977,631 | ||||
| Democratic hold | Swing | ||||
Incumbent John Kerry sought another Senate term in Massachusetts.[70] Republican author and conservative activist Jerome Corsi, known for his public criticism of Kerry, had stated that he would run for the seat in 2008 but later changed his mind. Jim Ogonowski, a retired Air Force pilot who was closely defeated by now-Representative Niki Tsongas in a 2007 special election, was running against Kerry.[71] but failed to obtain the required candidacy signatures. The Republican challenger turned out to be Jeff Beatty, an ex-Army Delta Force officer who garnered 30% of the vote in a challenge to Democratic Congressman Bill Delahunt in 2006. Kerry was challenged by defense attorney Edward O'Reilly for the Democratic nomination, winning 69% of the vote to O'Reilly's 31%.
Kerry won with 66% of the vote to Beatty's 31%. Libertarian Robert J. Underwood had 3%.
Michigan[edit]
| |||||||||||||||||
 Levin: 40–50% 50–60% 60–70% 70–80% Hoogendyk: 40–50% 50–60% | |||||||||||||||||
| |||||||||||||||||

.jpg)
| Party | Candidate | Votes | % | ±% | |
|---|---|---|---|---|---|
| Democratic | Carl Levin (Incumbent) | 3,038,386 | 62.7% | +2.1% | |
| Republican | Jack Hoogendyk | 1,641,070 | 33.8% | -4.1% | |
| Libertarian | Scotty Boman | 76,347 | 1.6% | n/a | |
| Green | Harley Mikkelson | 43,440 | 0.9% | +0.1% | |
| U.S. Taxpayers | Michael Nikitin | 30,827 | 0.6% | n/a | |
| Natural Law | Doug Dern | 18,550 | 0.4% | +0.1% | |
| Majority | 1,397,316 | ||||
| Turnout | 4,848,620 | ||||
| Democratic hold | Swing | ||||
With the Democratic Party takeover of Capitol Hill in the 2006 midterm elections, senator Carl Levin had become one of the most powerful people in Washington as chairman of the Senate Armed Services Committee. He was expected[by whom?] to easily win re-election.
Challenging Levin were Republican State Representative Jack Hoogendyk, Green candidate Harley G. Mikkelson, US Taxpayers' candidate Mike Nikitin, Libertarian professor Scotty Boman, and Natural Law's candidate Doug Dern.[73]
Levin won re-election with 63% of the vote, to Hoogendyk's 34%.
Minnesota[edit]
| |||||||||||||||||||||
 Franken: 40–50% 50–60% Coleman: 40–50% 50–60% | |||||||||||||||||||||
| |||||||||||||||||||||


| Party | Candidate | Votes | % | |
|---|---|---|---|---|
| Democratic (DFL) | Al Franken | 164,136 | 65.34% | |
| Democratic (DFL) | Priscilla Lord Faris | 74,655 | 29.72% | |
| Democratic (DFL) | Dick Franson | 3,923 | 1.56% | |
| Democratic (DFL) | Bob Larson | 3,152 | 1.25% | |
| Democratic (DFL) | Rob Fitzgerald | 3,095 | 1.23% | |
| Democratic (DFL) | Ole Savior | 1,227 | 0.49% | |
| Democratic (DFL) | Alve Erickson | 1,017 | 0.40% | |
| Turnout | 251,205 | |||
| Party | Candidate | Votes | % | |
|---|---|---|---|---|
| Independence | Dean Barkley | 6,678 | 58.88% | |
| Independence | Jack Uldrich | 1,405 | 12.39% | |
| Independence | Stephen Williams | 800 | 7.05% | |
| Independence | Kurt Michael Anderson | 761 | 6.71% | |
| Independence | Doug Williams | 639 | 5.63% | |
| Independence | Darryl Stanton | 618 | 5.45% | |
| Independence | Bill Dahn | 440 | 3.88% | |
| Turnout | 11,341 | |||
| Party | Candidate | Votes | % | |
|---|---|---|---|---|
| Republican | Norm Coleman (Incumbent) | 130,973 | 91.32% | |
| Republican | Jack Shepard | 12,456 | 8.68% | |
| Turnout | 143,429 | |||
2007 year-end reports filed with the Federal Election Commission showed that Al Franken had raised $7.04 million through December 31, 2007, while Norm Coleman had raised $6.24 million. Year-end cash on hand was $6.04 million for Coleman and $3.10 million for Franken.[75]

| Party | Candidate | Votes | % | |
|---|---|---|---|---|
| Republican | Norm Coleman (Incumbent) | 1,211,590 | 41.988% | |
| Democratic (DFL) | Al Franken | 1,211,375 | 41.981% | |
| Independence | Dean Barkley | 437,404 | 15.19% | |
| Libertarian | Charles Aldrich | 13,916 | 0.48% | |
| Constitution | James Niemackl | 8,905 | 0.31% | |
| Write-ins | 2,365 | 0.08% | ||
| Plurality | 215 | 0.007% | ||
| Turnout | 2,885,555 | |||
Note: The ±% column reflects the change in total number of votes won by each party from the previous election. Additionally, votes cast for Paul Wellstone in the 2002 election are not factored into the DFL's total from that year.


| Party | Candidate | Votes | % | |
|---|---|---|---|---|
| Democratic (DFL) | Al Franken | 1,212,431 | 41.991% | |
| Republican | Norm Coleman (Incumbent) | 1,212,206 | 41.984% | |
| Independence | Dean Barkley | 437,505 | 15.15% | |
| Libertarian | Charles Aldrich | 13,923 | 0.48% | |
| Constitution | James Niemackl | 8,907 | 0.31% | |
| Write-ins | 2,365 | 0.08% | ||
| Plurality | 225 | 0.007% | ||
| Turnout | 2,887,337 | |||
| Party | Candidate | Votes | % | |
|---|---|---|---|---|
| Democratic (DFL) | Al Franken | 1,212,629 | 41.994% | |
| Republican | Norm Coleman (Incumbent) | 1,212,317 | 41.983% | |
| Independence | Dean Barkley | 437,505 | 15.151% | |
| Libertarian | Charles Aldrich | 13,923 | 0.48% | |
| Constitution | James Niemackl | 8,907 | 0.31% | |
| Write-ins | 2,365 | 0.08% | ||
| Plurality | 312 | 0.011% | ||
| Turnout | 2,887,646 | |||
| Democratic (DFL) gain from Republican | ||||
The 2008 U.S. Senate election in Minnesota featured first-term Republican incumbent senator Norm Coleman, Democrat Al Franken, a comedian and radio personality, and former U.S. senator Dean Barkley, a member of the Independence Party of Minnesota.
A December 2007 poll showed Coleman's approval rating among Minnesota voters at 53%.[83] The seat was heavily targeted by the Democratic Senatorial Campaign Committee because of Minnesota's Democratic leanings and recent Democratic gains in national and statewide elections. These factors, coupled with a national political climate favorable to Democrats, made the Minnesota Senate race one of the most competitive and closely watched of the cycle.
Franken announced his candidacy on February 14, 2007, more than 20 months before the election.[84] Jack Nelson-Pallmeyer, a professor at the University of St. Thomas (St. Paul, Minnesota), joined the race in October 2007.[85] Attorney Mike Ciresi, an unsuccessful candidate in the 2000 Democratic U.S. Senate primary, was considered a serious candidate, but withdrew from the race on March 10, 2008, clearing the path for Franken to secure the party's nomination.
Barkley, who had briefly been appointed Senator after the death of Paul Wellstone in 2002, ran under the banner of the Independence Party, the largest third party in Minnesota.[86][87] He was included in most of the debates and ultimately received 15% of the vote in the general election, a strong showing for a third party candidate. It is not clear whether Barkley detracted more votes from Coleman or Franken.
Polls over the course of the campaign indicated that the race was very competitive, with many polls showing Franken and Coleman virtually tied or within the margin of error, as well as several polls showing each candidate with a significant lead at one point or another. The presence of a serious third party candidate further complicated matters.
On November 4, 2008, Coleman received 1,211,590 votes to Franken's 1,211,375 votes, a margin of 215 votes, far less than 0.1%, thereby triggering an automatic recount. Barkley received 437,404 votes, about 15% of total votes cast.[88]
On January 3, 2009, with the recount apparently completed, Franken had an unofficial lead of 225 votes, but former senator Coleman's attorneys contested the official results in the courts.[89] During the recount process, Minnesota was represented by only one senator, Amy Klobuchar.
On April 13, 2009, a three-judge panel ruled that Al Franken received the most votes in Minnesota's 2008 Senate race and ruled against Coleman's claims on all counts.[90] Coleman appealed this decision.[91] On June 30, 2009, the Minnesota Supreme Court ruled unanimously that Al Franken received the most votes, and Norm Coleman conceded defeat after the ruling, allowing Al Franken to be Senator-elect of Minnesota.[citation needed] Franken was sworn in as Minnesota's junior senator on July 7.
Mississippi[edit]
Mississippi (regular)[edit]
| |||||||||||||||||
 Cochran: 50–60% 60–70% 70–80% 80–90% Fleming: 50–60% 60–70% 70–80% 80–90% | |||||||||||||||||
| |||||||||||||||||
_(cropped)1.jpg)

Incumbent Republican Thad Cochran announced that he would seek re-election for a sixth term.[92] Cochran, who has not faced serious opposition since he was re-elected in 1984, faced Democratic state Representative Erik R. Fleming, whom he defeated with 61% of the vote.
| Party | Candidate | Votes | % | ±% | |
|---|---|---|---|---|---|
| Republican | Thad Cochran (Incumbent) | 766,111 | 61.44% | -23.2% | |
| Democratic | Erik Fleming | 480,915 | 38.56% | n/a | |
| Majority | 285,196 | ||||
| Turnout | 1,247,026 | ||||
| Republican hold | Swing | ||||
Mississippi (special)[edit]
| |||||||||||||||||
| |||||||||||||||||
 Wicker: 50–60% 60–70% 70–80% Musgrove: 50–60% 60–70% 70–80% 80–90% | |||||||||||||||||
| |||||||||||||||||
.jpg)

Roger Wicker, formerly the representative of Mississippi's 1st congressional district, was appointed by Governor Haley Barbour on December 31, 2007, to fill the vacancy caused by the December 18 resignation of Trent Lott.[94][95] It had been speculated that Lott wished to resign before a new lobbying reform law, effective the first day of 2008, took effect; having resigned before the end of 2007, Lott may become a lobbyist in 2009 instead of 2010.[95] Controversy arose when Barbour called for the special election to be held on the same day as the general election. As a result, Mississippi's Attorney General Jim Hood challenged Barbour in court, claiming that the special election needed to be held within 100 days of Lott's resignation, as per state law.[96] Initially, a Mississippi Circuit Court judge sided with Hood, ruling that the election take place on or before March 19, 2008.[97] However, Barbour filed an appeal to the Mississippi Supreme Court, which overturned the earlier ruling and set the special election for November 4, 2008.[98][99]
Democratic former Governor Ronnie Musgrove challenged Wicker. Another Democrat, former Congressman Ronnie Shows, also filed to run, but he withdrew in February 2008 and endorsed Musgrove.[100][101] Wicker beat Musgrove 55% to 45%.
| Party | Candidate | Votes | % | ±% | |
|---|---|---|---|---|---|
| Republican | Roger Wicker (incumbent) | 683,409 | 54.96% | -8.6% | |
| Democratic | Ronnie Musgrove | 560,064 | 45.04% | +9.9% | |
| Majority | 123,345 | ||||
| Turnout | 1,243,473 | ||||
| Republican hold | Swing | ||||
Montana[edit]
| |||||||||||||||||
 County results Baucus: 50–60% 60–70% 70–80% 80–90% | |||||||||||||||||
| |||||||||||||||||

.jpg)
Senator Max Baucus was a popular Democrat in Montana, representing a state that has long been fairly Republican but also receptive to Democrats in state and local elections. President Bush won Montana by more than 20 points in both 2000 and 2004, but Montana also had a popular Democratic governor, Brian Schweitzer, and a newly elected Democratic junior senator, Jon Tester. Baucus was not expected to face a significant challenge from the 85-year-old Republican nominee, Bob Kelleher, who surprised observers by winning the June 3 Republican primary despite supporting a number of positions that put him to the political left of Baucus, such as nationalization of the American oil and gas industry.[103]
Baucus easily won re-election, taking 73% of the vote, with Kelleher taking 27%.
| Party | Candidate | Votes | % | |
|---|---|---|---|---|
| Democratic | Max Baucus (Incumbent) | 165,050 | 100.00% | |
| Total votes | 165,050 | 100.00% | ||
| Party | Candidate | Votes | % | |
|---|---|---|---|---|
| Republican | Bob Kelleher | 26,936 | 36.32% | |
|
| ||||