2010 United States Senate elections
 From Wikipedia the free encyclopedia
| |||||||||||||||||||||||||||||||||||||||||||||||||||||||||||||||||
37 of the 100 seats in the United States Senate 51 seats needed for a majority | |||||||||||||||||||||||||||||||||||||||||||||||||||||||||||||||||
|---|---|---|---|---|---|---|---|---|---|---|---|---|---|---|---|---|---|---|---|---|---|---|---|---|---|---|---|---|---|---|---|---|---|---|---|---|---|---|---|---|---|---|---|---|---|---|---|---|---|---|---|---|---|---|---|---|---|---|---|---|---|---|---|---|---|
| |||||||||||||||||||||||||||||||||||||||||||||||||||||||||||||||||
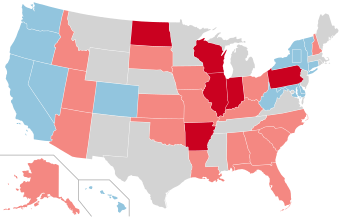 Results of the elections: (excl. Massachusetts) Democratic hold Republican hold Republican gain No election Rectangular inset (N.Y.): both seats up for election | |||||||||||||||||||||||||||||||||||||||||||||||||||||||||||||||||
| |||||||||||||||||||||||||||||||||||||||||||||||||||||||||||||||||
.jpg)
.jpg)
The 2010 United States Senate elections were held on November 2, 2010, from among the United States Senate's 100 seats. A special election was held on January 19, 2010, for a mid-term vacancy in Massachusetts. Thirty-four of the November elections were for six-year terms to the Senate's Class 3, while other three were special elections to finish incomplete terms. Those 37 November elections featured 19 incumbent Democrats (seven of whom retired or were defeated in the primary) and 18 incumbent Republicans (eight of whom retired or were defeated in the primary).
After the 2008 elections, the Senate was composed of 58 Democrats, 40 Republicans, and 2 independents who caucused with the Democrats. However, in a January 2010 special election, Republicans picked up a seat in Massachusetts thereby reducing Democrats' majority to 57 seats.
Republicans won four seats held by retiring Democrats and also defeated two incumbent Democrats, for a Republican net gain of six seats. This was the first time since 1994 that Republicans successfully defended all of their own seats. This was also the fourth consecutive election of Class 3 senators where Democrats failed to gain seats. Despite the Republican gains, the Democrats retained a majority of the Senate with 51 seats plus the two independents who caucused with them, compared to the 47 Republican seats. As of 2023[update], this was the last time Republicans won U.S. Senate seats in Illinois and New Hampshire.
Results summary[edit]
| 51 | 2 | 47 |
| Democratic | Independent | Republican |
Shading indicates party with largest share of that line. Does not include the January 2010 special election in Massachusetts.
| Parties | Total | |||||||||||||||||||||||||||||||||||||||||||||||||||||||||||||||||||||||||||||||||||||||||||||||||
|---|---|---|---|---|---|---|---|---|---|---|---|---|---|---|---|---|---|---|---|---|---|---|---|---|---|---|---|---|---|---|---|---|---|---|---|---|---|---|---|---|---|---|---|---|---|---|---|---|---|---|---|---|---|---|---|---|---|---|---|---|---|---|---|---|---|---|---|---|---|---|---|---|---|---|---|---|---|---|---|---|---|---|---|---|---|---|---|---|---|---|---|---|---|---|---|---|---|---|
| Democratic | Republican | Independent | Libertarian | Green | Constitution | Others | ||||||||||||||||||||||||||||||||||||||||||||||||||||||||||||||||||||||||||||||||||||||||||||
| Last elections (2008) Before the November elections | 57 | 41 | 2[c] | — | — | — | — | 100 | ||||||||||||||||||||||||||||||||||||||||||||||||||||||||||||||||||||||||||||||||||||||||||
| Not Up | Total | 38 | 23 | 2[c] | — | — | — | — | 63 | |||||||||||||||||||||||||||||||||||||||||||||||||||||||||||||||||||||||||||||||||||||||||
| Class 1 (2006→2012) | 19 | 10 | 2[c] | — | — | — | — | 31 | ||||||||||||||||||||||||||||||||||||||||||||||||||||||||||||||||||||||||||||||||||||||||||
| Class 2 (2008→2014) | 19 | 13 | — | — | — | — | — | 32 | ||||||||||||||||||||||||||||||||||||||||||||||||||||||||||||||||||||||||||||||||||||||||||
| Up | Total | 19 | 18 | — | — | — | — | — | 37 | |||||||||||||||||||||||||||||||||||||||||||||||||||||||||||||||||||||||||||||||||||||||||
| Class 1 | 2 | — | — | — | — | — | — | 2 | ||||||||||||||||||||||||||||||||||||||||||||||||||||||||||||||||||||||||||||||||||||||||||
| Class 2 | 1 | — | — | — | — | — | — | 1 | ||||||||||||||||||||||||||||||||||||||||||||||||||||||||||||||||||||||||||||||||||||||||||
| Class 3 | 16 | 18 | — | — | — | — | — | 34 | ||||||||||||||||||||||||||||||||||||||||||||||||||||||||||||||||||||||||||||||||||||||||||
| Incumbent retired | Total before | 6[d] | 6 | — | — | — | — | — | 12 | |||||||||||||||||||||||||||||||||||||||||||||||||||||||||||||||||||||||||||||||||||||||||
| Held by same party | 3 | 6 | — | — | — | — | — | 9 | ||||||||||||||||||||||||||||||||||||||||||||||||||||||||||||||||||||||||||||||||||||||||||
| Replaced by other party | — | — | — | — | — | 3 | ||||||||||||||||||||||||||||||||||||||||||||||||||||||||||||||||||||||||||||||||||||||||||||
| Result after | 3 | 9 | — | — | — | — | — | 12 | ||||||||||||||||||||||||||||||||||||||||||||||||||||||||||||||||||||||||||||||||||||||||||
| Incumbent ran | Total before | 13[e][f] | 12[g] | — | — | — | — | — | 25 | |||||||||||||||||||||||||||||||||||||||||||||||||||||||||||||||||||||||||||||||||||||||||
| Won election | 10[e] | 10 | — | — | — | — | — | 20 | ||||||||||||||||||||||||||||||||||||||||||||||||||||||||||||||||||||||||||||||||||||||||||
| Lost re-election | — | — | — | — | — | 2 | ||||||||||||||||||||||||||||||||||||||||||||||||||||||||||||||||||||||||||||||||||||||||||||
| Lost renomination but won re-election | — | 1 | — | — | — | — | — | 1 | ||||||||||||||||||||||||||||||||||||||||||||||||||||||||||||||||||||||||||||||||||||||||||
| Lost renomination but party held | — | 1 | — | — | — | — | — | 1 | ||||||||||||||||||||||||||||||||||||||||||||||||||||||||||||||||||||||||||||||||||||||||||
| Lost renomination and party lost | — | — | — | — | — | 1 | ||||||||||||||||||||||||||||||||||||||||||||||||||||||||||||||||||||||||||||||||||||||||||||
| Result after | 10[e] | 15 | — | — | — | — | — | 25 | ||||||||||||||||||||||||||||||||||||||||||||||||||||||||||||||||||||||||||||||||||||||||||
| Total elected | 13[e] | 24 | — | — | — | — | — | 37 | ||||||||||||||||||||||||||||||||||||||||||||||||||||||||||||||||||||||||||||||||||||||||||
| Net gain/loss | — | — | — | — | — | 6 | ||||||||||||||||||||||||||||||||||||||||||||||||||||||||||||||||||||||||||||||||||||||||||||
| Nationwide vote | Votes | 32,405,787 | 34,616,463 | 155,846[h] | 776,327 | 552,006 | 178,860 | 3,100,833[h] | 71,786,122 | |||||||||||||||||||||||||||||||||||||||||||||||||||||||||||||||||||||||||||||||||||||||||
| Share | 45.14% | 48.22% | 0.22% | 1.08% | 0.77% | 0.25% | 4.32% | 100% | ||||||||||||||||||||||||||||||||||||||||||||||||||||||||||||||||||||||||||||||||||||||||||
| Result | 51 | 47 | 2[c] | — | — | — | — | 100 | ||||||||||||||||||||||||||||||||||||||||||||||||||||||||||||||||||||||||||||||||||||||||||
| End of this Congress | 56 | 42 | 2[c] | — | — | — | — | 100 | ||||||||||||||||||||||||||||||||||||||||||||||||||||||||||||||||||||||||||||||||||||||||||
Source: Clerk of the U.S. House of Representatives[1]
Change in composition[edit]
After the January special election[edit]
| D1 | D2 | D3 | D4 | D5 | D6 | D7 | D8 | D9 | D10 |
| D20 | D19 | D18 | D17 | D16 | D15 | D14 | D13 | D12 | D11 |
| D21 | D22 | D23 | D24 | D25 | D26 | D27 | D28 | D29 | D30 |
| D40 | D39 | D38 | D37 | D36 | D35 | D34 | D33 | D32 | D31 |
| D41 | D42 | D43 | D44 | D45 | D46 | D47 | D48 | D49 | D50 |
| Majority → | D51 | ||||||||
| R41 Mass. (sp) Gain | I2 | I1 | D57 | D56 | D55 | D54 | D53 | D52 | |
| R40 | R39 | R38 | R37 | R36 | R35 | R34 | R33 | R32 | R31 |
| R21 | R22 | R23 | R24 | R25 | R26 | R27 | R28 | R29 | R30 |
| R20 | R19 | R18 | R17 | R16 | R15 | R14 | R13 | R12 | R11 |
| R1 | R2 | R3 | R4 | R5 | R6 | R7 | R8 | R9 | R10 |
Before the November elections[edit]
| D1 | D2 | D3 | D4 | D5 | D6 | D7 | D8 | D9 | D10 |
| D20 | D19 | D18 | D17 | D16 | D15 | D14 | D13 | D12 | D11 |
| D21 | D22 | D23 | D24 | D25 | D26 | D27 | D28 | D29 | D30 |
| D40 Calif. Ran | D39 Ark. Ran | D38 | D37 | D36 | D35 | D34 | D33 | D32 | D31 |
| D41 Colo. Ran | D42 Conn. Retired | D43 Del. (sp) Retired | D44 Hawaii Ran | D45 Ill. (reg) Ill. (sp) Retired | D46 Ind. Retired | D47 Md. Ran | D48 Nev. Ran | D49 N.Y. (reg) Ran | D50 N.Y. (sp) Ran |
| Majority → | D51 N.D. Retired | ||||||||
| R41 Utah Ran | I2 | I1 | D57 Wis. Ran | D56 W.Va. (sp) Retired | D55 Wash. Ran | D54 Vt. Ran | D53 Pa. Ran | D52 Ore. Ran | |
| R40 S.D. Ran | R39 S.C. Ran | R38 Okla. Ran | R37 Ohio Retired | R36 N.C. Ran | R35 N.H. Retired | R34 Mo. Retired | R33 La. Ran | R32 Ky. Retired | R31 Kan. Retired |
| R21 | R22 | R23 | R24 Ala. Ran | R25 Alaska Ran | R26 Ariz. Ran | R27 Fla. Retired | R28 Ga. Ran | R29 Idaho Ran | R30 Iowa Ran |
| R20 | R19 | R18 | R17 | R16 | R15 | R14 | R13 | R12 | R11 |
| R1 | R2 | R3 | R4 | R5 | R6 | R7 | R8 | R9 | R10 |
Result of the November elections[edit]
| D1 | D2 | D3 | D4 | D5 | D6 | D7 | D8 | D9 | D10 |
| D20 | D19 | D18 | D17 | D16 | D15 | D14 | D13 | D12 | D11 |
| D21 | D22 | D23 | D24 | D25 | D26 | D27 | D28 | D29 | D30 |
| D40 Colo. Elected[i] | D39 Calif. Re-elected | D38 | D37 | D36 | D35 | D34 | D33 | D32 | D31 |
| D41 Conn. Hold | D42 Del. (sp) Hold | D43 Hawaii Re-elected | D44 Md. Re-elected | D45 Nev. Re-elected | D46 N.Y. (reg) Re-elected | D47 N.Y. (sp) Elected[i] | D48 Ore. Re-elected | D49 Vt. Re-elected | D50 Wash. Re-elected |
| Majority → | D51 W.Va. (sp) Hold | ||||||||
| R41 Utah Hold | R42 Ark. Gain | R43 Ill. (reg) Ill. (sp) Gain[j] | R44 Ind. Gain | R45 N.D. Gain | R46 Pa. Gain | R47 Wis. Gain | I2 | I1 | |
| R40 S.D. Re-elected | R39 S.C. Re-elected | R38 Okla. Re-elected | R37 Ohio Hold | R36 N.C. Re-elected | R35 N.H. Hold | R34 Mo. Hold | R33 La. Re-elected | R32 Ky. Hold | R31 Kan. Hold |
| R21 | R22 | R23 | R24 Ala. Re-elected | R25 Alaska Re-elected | R26 Ariz. Re-elected | R27 Fla. Hold | R28 Ga. Re-elected | R29 Idaho Re-elected | R30 Iowa Re-elected |
| R20 | R19 | R18 | R17 | R16 | R15 | R14 | R13 | R12 | R11 |
| R1 | R2 | R3 | R4 | R5 | R6 | R7 | R8 | R9 | R10 |
| Key: |
|
|---|
Final pre-election predictions[edit]
Several sites and individuals publish predictions of competitive seats. These predictions look at factors such as the strength of the incumbent (if the incumbent is running for reelection) and the other candidates, and the state's partisan lean (reflected in part by the state's Cook Partisan Voting Index rating). The predictions assign ratings to each seat, indicating the predicted advantage that a party has in winning that seat.
Most election predictors used:
- "tossup": no advantage
- "tilt" (used by some predictors): advantage that is not quite as strong as "lean"
- "lean": slight advantage
- "likely" or "favored": significant, but surmountable, advantage
- "safe" or "solid": near-certain chance of victory
Where a site gives a percentage probability as its primary indicator of expected outcome, the chart below classifies a race as follows:
- Tossup: 50-55%
- Tilt: 56-60%
- Lean: 61-75%
- Likely: 76-93%
- Safe: 94-100%
| Constituency | Incumbent | 2010 election ratings | |||||||||
|---|---|---|---|---|---|---|---|---|---|---|---|
| State | Senator | Last election[k] | Cook[2] | Rothenberg[3] | RCP[4] | Sabato[5] | CQ Politics[6] | Result | |||
| Alabama | Richard Shelby | 67.5% R | Safe R | Safe R | Safe R | Safe R | Safe R | Shelby 65.2% R | |||
| Alaska | Lisa Murkowski | 48.6% R | Likely R | Safe R | Likely R | Likely R | Likely R | Murkowski 39.5% R[l] | |||
| Arizona | John McCain | 76.7% R | Safe R | Safe R | Safe R | Safe R | Safe R | McCain 59.2% R | |||
| Arkansas | Blanche Lincoln | 55.9% D | Lean R (flip) | Likely R (flip) | Safe R (flip) | Safe R (flip) | Lean R (flip) | Boozman 57.9% R (flip) | |||
| California | Barbara Boxer | 57.7% D | Tossup | Tilt D | Tossup | Lean D | Lean D | Boxer 52.2% D | |||
| Colorado | Michael Bennet | Appointed (2009)[m] | Tossup | Tossup | Tossup | Lean R (flip) | Tossup | Bennet 48.1% D | |||
| Connecticut | Chris Dodd (retiring) | 66.4% D | Lean D | Likely D | Lean D | Lean D | Lean D | Blumenthal 55.2% D | |||
| Delaware (special) | Ted Kaufman (retired) | Appointed (2009)[n] | Likely D | Likely D | Likely D | Likely D | Likely D | Coons 56.6% D | |||
| Florida | George LeMieux (retired) | Appointed (2009)[o] | Safe R | Safe R | Likely R | Safe R | Likely R | Rubio 48.9% R | |||
| Georgia | Johnny Isakson | 57.9% R | Safe R | Safe R | Safe R | Safe R | Safe R | Isakson 58.3% R | |||
| Hawaii | Daniel Inouye | 75.5% D | Safe D | Safe D | Safe D | Safe D | Safe D | Inouye 74.8% D | |||
| Idaho | Mike Crapo | 99.2% R | Safe R | Safe R | Safe R | Safe R | Safe R | Crapo 71.2% R | |||
| Illinois | Roland Burris (retiring) | Appointed (2009)[p] | Tossup | Tilt R (flip) | Tossup | Lean R (flip) | Tossup | Kirk 48.0% R (flip) | |||
| Indiana | Evan Bayh (retiring) | 61.7% D | Safe R (flip) | Lean R (flip) | Likely R (flip) | Likely R (flip) | Safe R (flip) | Coats 54.6% R (flip) | |||
| Iowa | Chuck Grassley | 70.2% R | Safe R | Safe R | Safe R | Safe R | Safe R | Grassley 64.4% R | |||
| Kansas | Sam Brownback (retiring) | 69.9% R | Safe R | Safe R | Safe R | Safe R | Safe R | Moran 70.1% R | |||
| Kentucky | Jim Bunning (retiring) | 50.7% R | Lean R | Lean R | Lean R | Lean R | Lean R | Paul 55.7% R | |||
| Louisiana | David Vitter | 51.0% R | Lean R | Likely R | Likely R | Likely R | Likely R | Vitter 56.6% R | |||
| Massachusetts (special) | Paul G. Kirk (retiring) | Appointed (2009)[q] | Tossup | Lean R (flip) | Tossup | Tossup | Tossup | Brown 51.6% R (flip) | |||
| Maryland | Barbara Mikulski | 64.8% D | Safe D | Safe D | Safe D | Safe D | Safe D | Mikulski 62.2% D | |||
| Missouri | Kit Bond (retiring) | 56.1% R | Lean R | Lean R | Likely R | Likely R | Lean R | Blunt 54.2% R | |||
| Nevada | Harry Reid | 61.0% D | Tossup | Tossup | Tossup | Lean R (flip) | Tossup | Reid 50.3% D | |||
| New Hampshire | Judd Gregg (retiring) | 66.2% R | Lean R | Safe R | Lean R | Likely R | Lean R | Ayotte 60.1% R | |||
| New York (regular) | Chuck Schumer | 71.2% D | Safe D | Safe D | Safe D | Safe D | Safe D | Schumer 66.3% D | |||
| New York (special) | Kirsten Gillibrand | Appointed (2009)[r] | Safe D | Safe D | Likely D | Safe D | Safe D | Gillibrand 63.0% D | |||
| North Carolina | Richard Burr | 51.6% R | Likely R | Likely R | Likely R | Likely R | Likely R | Burr 54.8% R | |||
| North Dakota | Byron Dorgan (retiring) | 68.3% D | Safe R (flip) | Safe R (flip) | Safe R (flip) | Safe R (flip) | Safe R (flip) | Hoeven 76.1% R (flip) | |||
| Ohio | George Voinovich (retiring) | 63.9% R | Safe R | Safe R | Safe R | Likely R | Safe R | Portman 56.8% R | |||
| Oklahoma | Tom Coburn | 52.8% R | Safe R | Safe R | Safe R | Safe R | Safe R | Coburn 70.6% R | |||
| Oregon | Ron Wyden | 63.4% D | Safe D | Safe D | Likely D | Safe D | Safe D | Wyden 57.2% D | |||
| Pennsylvania | Arlen Specter (lost renomination) | 52.6% R[s] | Tossup | Tilt R (flip) | Lean R (flip) | Tossup | Tossup | Toomey 51.0% R (flip) | |||
| South Carolina | Jim DeMint | 53.7% R | Safe R | Safe R | Safe R | Safe R | Safe R | DeMint 61.5% R | |||
| South Dakota | John Thune | 60.6% R | Safe R | Safe R | Safe R | Safe R | Safe R | Thune 100.0% R | |||
| Utah | Bob Bennett (lost renomination) | 68.6% R | Safe R | Safe R | Safe R | Safe R | Safe R | Lee 61.6% R | |||
| Vermont | Patrick Leahy | 70.6% D | Safe D | Safe D | Safe D | Safe D | Safe D | Leahy 64.4% D | |||
| Washington | Patty Murray | 55.0% D | Tossup | Tossup | Tossup | Lean D | Tossup | Murray 52.1% | |||
| West Virginia (special) | Carte Goodwin (retiring) | Appointed (2010)[t] | Tossup | Tilt D | Tossup | Lean D | Tossup | Manchin 53.5% | |||
| Wisconsin | Russ Feingold | 55.3% D | Lean R (flip) | Lean R (flip) | Lean R (flip) | Lean R (flip) | Lean R (flip) | Johnson 51.6% R (flip) | |||
Gains and losses[edit]


Retirements[edit]
Three Democrats and six Republicans retired rather than seek re-election. Three Democrats retired rather than seek election to finish the unexpired term and one Democrat retired rather than seek election to finish the unexpired term and election to a full term.
Defeats[edit]
Three Democrats and one Republican sought re-election but lost in either the primary or general election.
| State | Senator | Replaced by |
|---|---|---|
| Arkansas | Blanche Lincoln | John Boozman |
| Pennsylvania | Arlen Specter | Pat Toomey |
| Utah | Bob Bennett | Mike Lee |
| Wisconsin | Russ Feingold | Ron Johnson |
Post-election changes[edit]
One Republican resigned on May 3, 2011, and was replaced by an appointee.
| State | Senator | Replaced by |
|---|---|---|
| Nevada (Class 1) | John Ensign | Dean Heller |
Race summary[edit]
Special elections during the 111th Congress[edit]
In these special elections, the winner was seated in the fall of 2010 (excluding Massachusetts), once they qualified and their elections were certified. Sorted by election date, then state, then class.
| State (linked to summaries below) | Incumbent | Results | Candidates | ||
|---|---|---|---|---|---|
| Senator | Party | Electoral history | |||
| Massachusetts (Class 1) | Paul G. Kirk | Democratic | 2009 (Appointed) | Interim appointee retired. New senator elected January 19, 2010. Republican gain. Winner seated February 4, 2010. |
|
| Delaware (Class 2) | Ted Kaufman | Democratic | 2009 (Appointed) | Interim appointee retired. New senator elected November 2, 2010. Democratic hold. Winner seated November 15, 2010. |
|
| Illinois (Class 3) | Roland Burris | Democratic | 2009 (Appointed) | Interim appointee retired. New senator elected November 2, 2010. Winner also elected to next term, see below. Republican gain. Winner seated November 29, 2010. |
|
| New York (Class 1) | Kirsten Gillibrand | Democratic | 2009 (Appointed) | Interim appointee elected November 2, 2010. |
|
| West Virginia (Class 1) | Carte Goodwin | Democratic | 2010 (Appointed) | Interim appointee retired. New senator elected November 2, 2010. Democratic hold. Winner seated November 15, 2010. |
|
Elections leading to the next Congress[edit]
Source: "Election 2010". The New York Times. Retrieved December 12, 2017.
In these regular elections, the winners were elected for the term beginning January 3, 2011; ordered by state.
All of the elections involved the Class 3 seats.
| State (linked to summaries below) | Incumbent | Results | Candidates | ||
|---|---|---|---|---|---|
| Senator | Party | Electoral history | |||
| Alabama | Richard Shelby | Republican | 1986[u] 1992 1998 2004 | Incumbent re-elected. |
|
| Alaska | Lisa Murkowski | Republican | 2002 (Appointed) 2004 | Incumbent lost renomination, but was re-elected as a write-in candidate. |
|
| Arizona | John McCain | Republican | 1986 1992 1998 2004 | Incumbent re-elected. |
|
| Arkansas | Blanche Lincoln | Democratic | 1998 2004 | Incumbent lost re-election. New senator elected. Republican gain. |
|
| California | Barbara Boxer | Democratic | 1992 1998 2004 | Incumbent re-elected. |
|
| Colorado | Michael Bennet | Democratic | 2009 (Appointed) | Interim appointee elected. |
|
| Connecticut | Chris Dodd | Democratic | 1980 1986 1992 1998 2004 | Incumbent retired. New senator elected. Democratic hold. |
|
| Florida | George LeMieux | Republican | 2009 (Appointed) | Interim appointee retired. New senator elected. Republican hold. |
|
| Georgia | Johnny Isakson | Republican | 2004 | Incumbent re-elected. |
|
| Hawaii | Daniel Inouye | Democratic | 1962 1968 1974 1980 1986 1992 1998 2004 | Incumbent re-elected. |
|
| Idaho | Mike Crapo | Republican | 1998 2004 | Incumbent re-elected. |
|
| Illinois | Roland Burris | Democratic | 2009 (Appointed) | Interim appointee retired. New senator elected. Winner also elected to finish term ending January 3, 2011, see above. Republican gain. Winner seated November 29, 2010. |
|
| Indiana | Evan Bayh | Democratic | 1998 2004 | Incumbent retired. New senator elected. Republican gain. |
|
| Iowa | Chuck Grassley | Republican | 1980 1986 1992 1998 2004 | Incumbent re-elected. |
|
| Kansas | Sam Brownback | Republican | 1996 (special) 1998 2004 | Incumbent retired to run for Governor of Kansas. New senator elected. Republican hold. |
|
| Kentucky | Jim Bunning | Republican | 1998 2004 | Incumbent retired. New senator elected. Republican hold. |
|
| Louisiana | David Vitter | Republican | 2004 | Incumbent re-elected. |
|
| Maryland | Barbara Mikulski | Democratic | 1986 1992 1998 2004 | Incumbent re-elected. |
|
| Missouri | Kit Bond | Republican | 1986 1992 1998 2004 | Incumbent retired. New senator elected. Republican hold. |
|
| Nevada | Harry Reid | Democratic | 1986 1992 1998 2004 | Incumbent re-elected. |
|
| New Hampshire | Judd Gregg | Republican | 1992 1998 2004 | Incumbent retired. New senator elected. Republican hold. |
|
| New York | Chuck Schumer | Democratic | 1998 2004 | Incumbent re-elected. |
|
| North Carolina | Richard Burr | Republican | 2004 | Incumbent re-elected. |
|
| North Dakota | Byron Dorgan | Democratic-NPL | 1992 1998 2004 | Incumbent retired. New senator elected. Republican gain. |
|
| Ohio | George Voinovich | Republican | 1998 2004 | Incumbent retired. New senator elected. Republican hold. |
|
| Oklahoma | Tom Coburn | Republican | 2004 | Incumbent re-elected. |
|
| Oregon | Ron Wyden | Democratic | 1996 (special) 1998 2004 | Incumbent re-elected. |
|
| Pennsylvania | Arlen Specter | Democratic | 1980[v] 1986 1992 1998 2004 | Incumbent lost renomination. New senator elected. Republican gain. |
|
| South Carolina | Jim DeMint | Republican | 2004 | Incumbent re-elected. |
|
| South Dakota | John Thune | Republican | 2004 | Incumbent re-elected. |
|
| Utah | Bob Bennett | Republican | 1992 1998 2004 | Incumbent lost renomination. New senator elected. Republican hold. |
|
| Vermont | Patrick Leahy | Democratic | 1974 1980 1986 1992 1998 2004 | Incumbent re-elected. |
|
| Washington | Patty Murray | Democratic | 1992 1998 2004 | Incumbent re-elected. |
|
| Wisconsin | Russ Feingold | Democratic | 1992 1998 2004 | Incumbent lost re-election. New senator elected. Republican gain. |
|
Closest races[edit]
Seven November races, as well as the Massachusetts special election in January, had margins less than 10%:
| District | Winner | Margin |
|---|---|---|
| Illinois | Republican (flip) | 1.6% |
| Colorado[7] | Democratic | 1.7% |
| Pennsylvania | Republican (flip) | 2.0% |
| Alaska | Republican | 4.0%[w] |
| Washington | Democratic | 4.7% |
| Massachusetts | Republican (flip) | 4.8% |
| Wisconsin | Republican (flip) | 4.8% |
| Nevada | Democratic | 5.7% |
California was the tipping point state, where Barbara Boxer (D) defeated Carly Fiorina (R) by a margin of 10.0%.
Alabama[edit]
| |||||||||||||||||
 County results Shelby: 50–60% 60–70% 70–80% 80–90% Barnes: 50–60% 60–70% 70–80% 80–90% | |||||||||||||||||
| |||||||||||||||||
.jpg)
.jpg)
Incumbent Republican Richard Shelby won re-election to a fifth term. On November 9, 1994, Shelby switched his party affiliation from Democratic to Republican, one day after the Republicans won control of both houses in the midterm elections, giving the Republicans a 53–47 majority in the Senate. He won his first full term as a Republican in 1998 by a large margin, and faced no significant opposition in 2004 and 2010.
| Party | Candidate | Votes | % | |
|---|---|---|---|---|
| Republican | Richard Shelby (Incumbent) | 405,042 | 84.4% | |
| Republican | Clint Moser | 75,190 | 15.6% | |
| Total votes | 479,189 | 100.0% | ||
Shelby had over $17 million in the bank, one of the highest of any candidate in the country. He had become even more popular in his opposition to the Troubled Asset Relief Program (TARP) and the Emergency Economic Stabilization Act of 2008, as the ranking member of the Senate Banking Committee.
In May, Shelby told reporters "I don't even know who my opponent is."[8]
| Party | Candidate | Votes | % | |
|---|---|---|---|---|
| Republican | Richard Shelby (Incumbent) | 968,181 | 65.3% | |
| Democratic | William G. Barnes | 515,619 | 34.7% | |
| Total votes | 1,482,910 | 100.0% | ||
| Turnout | N/A | |||
| Republican hold | ||||
Alaska[edit]
| |||||||||||||||||||||
 Borough and census area results Murkowski: 40–50% 50–60% 60–70% 70–80% Miller: 30–40% 40–50% 50–60% McAdams: 30–40% 40–50% | |||||||||||||||||||||
| |||||||||||||||||||||
.jpg)


The November general election in Alaska was preceded by primary elections which were held August 24, 2010. Scott McAdams, the Mayor of Sitka, became the Democratic nominee and Joe Miller, an attorney and former federal magistrate, became the Republican nominee after defeating incumbent Senator Lisa Murkowski[10] in the Republican primary.[11]
Murkowski garnered more than 100,000 write-in votes in the general election, many[clarification needed] of which were challenged by Miller for various errors including minor misspellings. The appeal was denied[12] Even if all the challenged votes were thrown out, Murkowski would have still had a lead of over 2,100 votes.[13]
| Party | Candidate | Votes | % | |
|---|---|---|---|---|
| Democratic | Scott McAdams | 18,035 | 49.99% | |
| Democratic | Jacob Seth Kern | 6,913 | 19.16% | |
| Libertarian | David Haase | 5,793 | 16.06% | |
| Democratic | Frank Vondersaar | 5,339 | 14.80% | |
| Total votes | 36,080 | 100.00% | ||
| Turnout | 32% | |||
| Party | Candidate | Votes | % | |
|---|---|---|---|---|
| Republican | Joe Miller | 55,878 | 50.91% | |
| Republican | Lisa Murkowski (Incumbent) | 53,872 | 49.09% | |
| Total votes | 109,750 | 100.00% | ||
| Turnout | 32% | |||
| Party | Candidate | Votes | % | |
|---|---|---|---|---|
| Write-In | Lisa Murkowski (Incumbent) | 101,091 | 39.49% | |
| Republican | Joe Miller | 90,839 | 35.49% | |
| Democratic | Scott McAdams | 60,045 | 23.46% | |
| Libertarian | David Haase | 1,459 | 0.57% | |
| Independent | Timothy Carter | 927 | 0.36% | |
| Independent | Ted Gianoutsos | 458 | 0.18% | |
| Write-In | Other write-in votes | 1,143 | 0.44% | |
| Invalid or blank votes | 2,784 | 1.08% | ||
| Total votes | 258,746 | 100.00% | ||
| Turnout | 52.3% | |||
Arizona[edit]
| |||||||||||||||||
 McCain: 40–50% 50–60% 60–70% Glassman: 50–60% | |||||||||||||||||
| |||||||||||||||||


Incumbent Republican John McCain, who returned to the Senate after losing the presidency to Barack Obama in the 2008 presidential election, ran for re-election to a fifth term and won.[19]
| Party | Candidate | Votes | % | |
|---|---|---|---|---|
| Democratic | Rodney Glassman | 86,881 | 34.7% | |
| Democratic | Cathy Eden | 66,421 | 26.5% | |
| Democratic | John Dougherty | 60,262 | 24.1% | |
| Democratic | Randy Parraz | 36,637 | 14.6% | |
| Total votes | 250,201 | 100.0% | ||
| Party | Candidate | Votes | % | |
|---|---|---|---|---|
| Republican | John McCain (Incumbent) | 284,374 | 56.2% | |
| Republican | J.D. Hayworth | 162,502 | 32.1% | |
| Republican | Jim Deakin | 59,447 | 11.7% | |
| Total votes | 506,323 | 100.0% | ||
After spending over $20 million during the primaries, McCain still had more than $1million cash on hand after the primary election. Glassman criticized McCain on women's issues.[21] In August 2010, Glassman released a TV advertisement called "Arizona First."[22]
| Party | Candidate | Votes | % | ±% | |
|---|---|---|---|---|---|
| Republican | John McCain (Incumbent) | 1,005,615 | 59.07% | -17.67% | |
| Democratic | Rodney Glassman | 592,011 | 34.78% | +14.16% | |
| Libertarian | David Nolan | 80,097 | 4.71% | +2.06% | |
| Green | Jerry Joslyn | 24,603 | 1.45% | N/A | |
| Majority | 413,604 | 24.30% | |||
| Total votes | 1,702,326 | 100.00% | |||
| Republican hold | Swing | ||||
Arkansas[edit]
| |||||||||||||||||
 Boozman: 40–50% 50–60% 60–70% 70–80% Lincoln: 40–50% 50–60% 60–70% | |||||||||||||||||
| |||||||||||||||||


Incumbent Democrat Blanche Lincoln ran for re-election to a third term, but lost to Republican nominee John Boozman. Boozman became the first Republican in 138 years to win the seat. Arkansas had previously only elected one Republican senator since the Reconstruction, who was defeated after his first term in 2002 by Mark Pryor.
| Party | Candidate | Votes | % | |
|---|---|---|---|---|
| Democratic | Blanche Lincoln (Incumbent) | 146,579 | 44.5% | |
| Democratic | Bill Halter | 140,081 | 42.5% | |
| Democratic | D.C. Morrison | 42,695 | 13.0% | |
| Total votes | 329,355 | 100.0% | ||
| Party | Candidate | Votes | % | |
|---|---|---|---|---|
| Democratic | Blanche Lincoln (Incumbent) | 134,758 | 52.0% | |
| Democratic | Bill Halter | 124,405 | 48.0% | |
| Total votes | 259,163 | 100.0% | ||
The Republican primary was held May 18, 2010, with early voting from May 3–17.
| Party | Candidate | Votes | % | |
|---|---|---|---|---|
| Republican | John Boozman | 75,010 | 52.7% | |
| Republican | Jim Holt | 24,826 | 17.5% | |
| Republican | Gilbert Baker | 16,540 | 11.6% | |
| Republican | Conrad Reynolds | 7,128 | 5.0% | |
| Republican | Curtis Coleman | 6,928 | 4.9% | |
| Republican | Kim Hendren | 5,551 | 3.9% | |
| Republican | Randy Alexander | 4,389 | 3.1% | |
| Republican | Fred Ramey | 1,888 | 1.3% | |
| Total votes | 142,260 | 100.0% | ||
| Party | Candidate | Votes | % | ±% | |
|---|---|---|---|---|---|
| Republican | John Boozman | 451,617 | 57.90% | +13.83% | |
| Democratic | Blanche Lincoln (Incumbent) | 288,156 | 36.95% | -18.95% | |
| Libertarian | Trevor Drown | 25,234 | 3.24% | +3.24% | |
| Green | John Gray | 14,430 | 1.85% | +1.85% | |
| Majority | 163,461 | 20.95% | |||
| Total votes | 779,437 | 100.00% | |||
| Turnout | |||||
| Republican gain from Democratic | Swing | ||||
California[edit]
| |||||||||||||||||
 County results Boxer: 40–50% 50–60% 60–70% 70–80% 80–90% Fiorina: 40–50% 50–60% 60–70% 70–80% | |||||||||||||||||
| |||||||||||||||||


Incumbent Democrat Barbara Boxer won re-election to a fourth term.
In 2009, Boxer was criticized for correcting a general who called her "ma'am". Brigadier General Michael Walsh was testifying on the Louisiana coastal restoration process in the wake of Hurricane Katrina and answered Boxer's query with "ma'am" when Boxer interrupted him. "Do me a favor," Boxer said. "can you say 'senator' instead of 'ma'am?'" "Yes, ma'am," Walsh interjected. "It's just a thing, I worked so hard to get that title, so I'd appreciate it. Thank you," she said. The Army's guide to protocol instructs service members to call members of the U.S. Senate "sir", "ma'am" or "senator".[28][29] Fiorina used this incident prominently in campaign ads, as did David Zucker, who directed a humorous commercial for RightChange.com titled 'Call Me Senator.' In February 2010, Carly Fiorina put out a campaign ad attacking Republican rival Tom Campbell featuring a "demon sheep", creating international, mostly negative, publicity.[30]
| Candidate | Votes | % | |
|---|---|---|---|
| Barbara Boxer (Incumbent) | 1,957,920 | 81.0% | |
| Brian Quintana | 338,442 | 13.9% | |
| Mickey Kaus | 123,573 | 5.1% | |
| Total votes | 2,419,935 | 100.0% | |
| Candidate | Votes | % | |
|---|---|---|---|
| Carly Fiorina | 1,315,429 | 56.4% | |
| Tom Campbell | 504,289 | 21.7% | |
| Chuck DeVore | 452,577 | 19.3% | |
| Al Ramirez | 42,149 | 1.8% | |
| Tim Kalemkarian | 19,598 | 0.8% | |
| Total votes | 2,334,042 | 100.0% | |
| Party | Candidate | Votes | % | |
|---|---|---|---|---|
| Democratic | Barbara Boxer (Incumbent) | 5,218,441 | 52.2% | |
| Republican | Carly Fiorina | 4,217,366 | 42.2% | |
| Libertarian | Gail Lightfoot | 175,242 | 1.8% | |
| Peace and Freedom | Marsha Feinland | 135,093 | 1.4% | |
| Green | Duane Roberts | 128,510 | 1.2% | |
| American Independent | Edward Noonan | 125,441 | 1.2% | |
| Write-ins | 67 | <0.1% | ||
| Total votes | 10,000,160 | 100.0% | ||
Colorado[edit]
| |||||||||||||||||
 County results Bennet: 40–50% 50–60% 60–70% 70–80% Buck: 40–50% 50–60% 60–70% 70–80% | |||||||||||||||||
| |||||||||||||||||

.jpg)
In December 2008, President-elect Barack Obama selected incumbent U.S. Senator Ken Salazar to become U.S. Secretary of the Interior.[31] After Salazar resigned from his seat,[32] Democratic Governor Bill Ritter appointed Denver Public Schools Superintendent Michael Bennet to fill the seat, who won re-election to his first full term.[33][34]
| Party | Candidate | Votes | % | |
|---|---|---|---|---|
| Democratic | Michael Bennet (Incumbent) | 183,225 | 54.2% | |
| Democratic | Andrew Romanoff | 154,961 | 45.8% | |
| Total votes | 338,186 | 100.00% | ||
| Party | Candidate | Votes | % | |
|---|---|---|---|---|
| Republican | Ken Buck | 209,638 | 51.6% | |
| Republican | Jane Norton | 196,954 | 48.4% | |
| Total votes | 406,592 | 100.0% | ||
This was one of the most expensive elections in the 2010 cycle, with more than $50 million spent total, including over $35 million in outside spending.[36] Conservative third party groups hammered Bennet for voting 92% of the time with the Democratic leadership, including voting for healthcare reform and the stimulus package.[37] Liberal third party groups called Buck extremist. Bennet focused on attacking Buck's views on abortion, which he believed should be banned including those of cases of rape and incest. He was also attacked for wanting to eliminate the 17th Amendment[38] and refusing to prosecute an alleged rapist as Weld County district attorney. Planned Parenthood mounted a mail campaign, targeting women voters with the warning that "Colorado women can't trust Ken Buck." Bennet won the women vote by 17 points according to exit polls. After the election, Buck conceded to the Denver Post that the main reason why he lost is because of social issues.[39]
| Party | Candidate | Votes | % | |
|---|---|---|---|---|
| Democratic | Michael Bennet (Incumbent) | 851,590 | 48.1% | |
| Republican | Ken Buck | 822,731 | 46.4% | |
| Green | Bob Kinsey | 38,768 | 2.2% | |
| Libertarian | Maclyn Stringer | 22,589 | 1.3% | |
| Independent | Jason Napolitano | 19,415 | 1.1% | |
| Independent | Charley Miller | 11,330 | 0.6% | |
| Independent | J. Moromisato | 5,767 | 0.3% | |
| Total votes | 1,772,190 | 100.0% | ||
| Turnout | {{{votes}}} | N/A | ||
Connecticut[edit]
| Turnout | 45.9% (voting eligible) | ||||||||||||||||
|---|---|---|---|---|---|---|---|---|---|---|---|---|---|---|---|---|---|
| |||||||||||||||||
  Blumenthal: 40–50% 50–60% 60–70% 70–80% 80–90% McMahon: 40–50% 50–60% 60–70% | |||||||||||||||||
| |||||||||||||||||


Incumbent Democrat Christopher Dodd suffered from dropping approval ratings in the past few years due to major controversies, leading him to announce in January 2010 that he would retire, instead of seeking a sixth term.[42] As Dodd was a Democrat, Richard Blumenthal, incumbent State Attorney General, announced on the same day that he would run for Dodd's seat.[43] The Connecticut Democratic Party nominated Blumenthal on May 21. Businesswoman Linda McMahon won the state party's nominating convention and the August 10 Republican primary to become the Republican candidate.[44]
| Party | Candidate | Votes | % | |
|---|---|---|---|---|
| Republican | Linda McMahon | 60,479 | 49.44% | |
| Republican | Rob Simmons | 34,011 | 27.80% | |
| Republican | Peter Schiff | 27,831 | 22.75% | |
| Total votes | 122,321 | 100.00% | ||
| Party | Candidate | Votes | % | ±% | |
|---|---|---|---|---|---|
| Democratic | Richard Blumenthal | 636,040 | 55.16% | -11.20% | |
| Republican | Linda E. McMahon | 498,341 | 43.22% | +11.08% | |
| Independent | Warren B. Mosler | 11,275 | 0.98% | N/A | |
| Independent | Dr. John Mertens | 6,735 | 0.58% | N/A | |
| Write-In | Write-in candidates (8) | 724 | 0.06% | N/A | |
| Majority | 137,755 | 11.95% | |||
| Total votes | 1,153,115 | 100.00% | |||
| Democratic hold | |||||
Note: Blumenthal also appeared on the line of the Connecticut Working Families Party and received 30,836 votes on it. His Working Families and Democratic votes have been aggregated together on this table.
Delaware (special)[edit]
| |||||||||||||||||
 County results Coons: 60–70% | |||||||||||||||||
| |||||||||||||||||
.jpg)

This was a special election to fill Delaware's Class 2 Senate seat, then held by Ted Kaufman, an appointee. The seat had been previously held by long-time Senator Joe Biden, who vacated it when he became Vice President of the United States in 2009.
| Party | Candidate | Votes | % | |
|---|---|---|---|---|
| Republican | Christine O'Donnell | 30,561 | 53.1% | |
| Republican | Michael N. Castle | 27,021 | 46.9% | |
| Total votes | 57,582 | 100.0% | ||
| Party | Candidate | Votes | % | ±% | |
|---|---|---|---|---|---|
| Democratic | Chris Coons | 174,012 | 56.61% | -8.07% | |
| Republican | Christine O'Donnell | 123,053 | 40.03% | +4.72% | |
| Independent | Glenn Miller | 8,201 | 2.67% | ||
| Libertarian | James Rash | 2,101 | 0.69% | ||
| Majority | 50,959 | 16.58% | -12.79% | ||
| Total votes | 307,367 | 100.00% | |||
| Democratic hold | Swing | ||||
Florida[edit]
| |||||||||||||||||||||
 Rubio: 30–40% 40–50% 50–60% 60–70% 70–80% Crist: 30–40% 40–50% Meek: 40–50% 50–60% 60–70% | |||||||||||||||||||||
| |||||||||||||||||||||


.jpg)
Incumbent Republican Senator Mel Martínez, who was elected in a very close race against Democrat Betty Castor with 49% of the vote in 2004, announced on December 2, 2008, that he would not run for re-election to a second term,[49] then announcing on August 7, 2009, that he would resign prior to the end of his term.[50] The Governor of Florida, Republican Charlie Crist, was required to appoint a successor and he chose his former Chief of Staff, George LeMieux. LeMieux, a placeholder who did not run in the election, replaced Martínez in the Senate on September 10, 2009.
Crist publicly announced he was running for the seat in mid-2009. When he declared his candidacy, he received many Republican endorsements, including the National Republican Senatorial Committee, Martínez, and 2008 Republican presidential nominee John McCain. However, his support of the American Recovery and Reinvestment Act of 2009 hurt his popularity among conservatives, and Tea Party candidate Marco Rubio, the former Speaker of the Florida House of Representatives, surged in the polls. In April 2010, Crist announced he would drop out of the Republican primary and run as an Independent. The National Republican Senatorial Committee withdrew its endorsement of Crist and demanded a refund of its campaign funds that it provided for the Crist campaign.[51][52][53] Rubio went on to win the Republican primary against only token opposition.
Polling initially showed Crist neck and neck with Rubio, but by the end of August Rubio opened up a solid and consistent lead. He was supported by Republican and some Independent voters whereas Democratic and other Independents were split between Crist and Meek. Rubio went on to win the election with 49% of the vote to Crist's 30% and Meek's 20%.
| Party | Candidate | Votes | % | |
|---|---|---|---|---|
| Republican | Marco Rubio | 1,059,513 | 84.6% | |
| Republican | William Kogut | 111,584 | 8.9% | |
| Republican | William Escoffery | 81,873 | 6.5% | |
| Total votes | 1,252,970 | 100.0% | ||
| Party | Candidate | Votes | % | |
|---|---|---|---|---|
| Democratic | Kendrick Meek | 522,942 | 57.4% | |
| Democratic | Jeff Greene | 283,370 | 31.1% | |
| Democratic | Glenn Burkett | 59,575 | 6.5% | |
| Democratic | Maurice Ferré | 44,506 | 4.9% | |
| Total votes | 910,393 | 100.0% | ||
| Party | Candidate | Votes | % | ±% | |
|---|---|---|---|---|---|
| Republican | Marco Antonio Rubio | 2,645,743 | 48.89% | -0.54% | |
| Independent | Charles Joseph Crist Jr. | 1,607,549 | 29.71% | +29.71% | |
| Democratic | Kendrick Brett Meek | 1,092,936 | 20.20% | -28.12% | |
| Libertarian | Alexander Snitker | 24,850 | 0.46% | N/A | |
| Independent | Sue Askeland | 15,340 | 0.28% | N/A | |
| Independent | Rick Tyler | 7,394 | 0.14% | N/A | |
| Constitution | Bernie DeCastro | 4,792 | 0.09% | N/A | |
| Independent | Lewis Jerome Armstrong | 4,443 | 0.08% | N/A | |
| Independent | Bobbie Bean | 4,301 | 0.08% | N/A | |
| Independent | Bruce Riggs | 3,647 | 0.07% | N/A | |
| Write-ins | 108 | 0.00% | |||
| Majority | 1,038,194 | 19.19% | +18.08% | ||
| Turnout | 5,411,106 | 48.25%[57] | -22.67% | ||
| Total votes | 5,411,106 | 100.00% | |||
| Republican hold | Swing | ||||
Georgia[edit]
| |||||||||||||||||
 Isakson: 40–50% 50–60% 60–70% 70–80% 80–90% Thurmond: 40–50% 50–60% 60–70% 70–80% | |||||||||||||||||
| |||||||||||||||||
.jpg)

Incumbent Republican Johnny Isakson won re-election to a second term.[58]
| Party | Candidate | Votes | % | |
|---|---|---|---|---|
| Democratic | Michael Thurmond | 297,226 | 84.3% | |
| Democratic | RJ Hadley | 55,159 | 15.7% | |
| Total votes | 352,385 | 100.0% | ||
| Party | Candidate | Votes | % | |
|---|---|---|---|---|
| Republican | Johnny Isakson | 558,298 | 100.00% | |
| Total votes | 558,298 | 100.00% | ||
| Party | Candidate | Votes | % | ±% | |
|---|---|---|---|---|---|
| Republican | Johnny Isakson (Incumbent) | 1,489,904 | 58.31% | +0.43% | |
| Democratic | Michael Thurmond | 996,516 | 39.00% | -0.98% | |
| Libertarian | Chuck Donovan | 68,750 | 2.69% | +0.55% | |
| Independent | Steve Davis (write-in) | 52 | 0.00% | N/A | |
| Independent | Raymond Beckworth (write-in) | 24 | 0.00% | N/A | |
| Independent | Brian Russell Brown (write-in) | 12 | 0.00% | N/A | |
| Majority | 493,388 | 19.31% | |||
| Total votes | 2,555,258 | 100.00% | |||
| Republican hold | Swing | ||||
Hawaii[edit]
| |||||||||||||||||
 County results Inouye: 70–80% | |||||||||||||||||
| |||||||||||||||||


Incumbent Democrat and President pro tempore Daniel Inouye won re-election to his ninth term.
Hawaii last elected a Republican Senator in 1970, and its current delegation to the United States Congress currently consists entirely of Democrats. Democrats have also won Hawaii's electoral votes in every presidential election since Ronald Reagan's landslide election in 1984. The exceptions at the time were then-Governor Linda Lingle (who was serving her second and final term) and then-U.S. Representative Charles Djou, both of whom were Republicans.
| Party | Candidate | Votes | % | |
|---|---|---|---|---|
| Democratic | Daniel Inouye (Incumbent) | 188,400 | 88.3% | |
| Democratic | Andy Woerner | 25,016 | 11.7% | |
| Total votes | 213,416 | 100.0% | ||
| Party | Candidate | Votes | % | |
|---|---|---|---|---|
| Republican | Campbell Cavasso | 21,865 | 66.7% | |
| Republican | John Roco | 7,190 | 21.9% | |
| Republican | Eddie Pirkowski | 3,744 | 11.4% | |
| Total votes | 32,790 | 100.0% | ||
| Party | Candidate | Votes | % | ±% | |
|---|---|---|---|---|---|
| Democratic | Daniel Inouye (Incumbent) | 277,228 | 74.81% | -0.70% | |
| Republican | Cam Cavasso | 79,939 | 21.57% | +0.58% | |
| Green | Jim Brewer | 7,762 | 2.09% | N/A | |
| Libertarian | Lloyd Jeffrey Mallen | 2,957 | 0.80% | -0.47% | |
| Independent | Jeff Jarrett | 2,697 | 0.73% | N/A | |
| Majority | 197,289 | 53.24% | |||
| Total votes | 370,583 | 100.00% | |||
| Democratic hold | Swing | ||||
Idaho[edit]
| |||||||||||||||||
 County results Crapo: 40–50% 50–60% 60–70% 70–80% 80–90% | |||||||||||||||||
| |||||||||||||||||

.jpg)
Incumbent Republican Mike Crapo won re-election to a third term.
| Party | Candidate | Votes | % | |
|---|---|---|---|---|
| Republican | Mike Crapo (Incumbent) | 127,332 | 79.3% | |
| Republican | Claude "Skip" Davis | 33,150 | 20.7% | |
| Total votes | 160,482 | 100.0% | ||
| Party | Candidate | Votes | % | |
|---|---|---|---|---|
| Democratic | Tom Sullivan | 18,340 | 74.7% | |
| Democratic | William Bryk | 6,227 | 25.3% | |
| Total votes | 24,567 | 100.0% | ||
Sullivan, a heavy underdog, criticized Crapo for being in Washington for too long saying "Senator Crapo has been in Congress for 18 years. The country is struggling, and I think it's time to make a change." Crapo emphasized his conservative record in Washington.[65]
| Party | Candidate | Votes | % | ±% | |
|---|---|---|---|---|---|
| Republican | Michael Crapo (Incumbent) | 319,953 | 71.19% | -27.99% | |
| Democratic | Tom Sullivan | 112,057 | 24.93% | N/A | |
| Constitution | Randy Bergquist | 17,429 | 3.88% | N/A | |
| Majority | 207,896 | 46.26% | |||
| Total votes | 449,439 | 100.00% | |||
| Republican hold | Swing | ||||
Illinois[edit]
| |||||||||||||||||
  Kirk: 40–50% 50–60% 60–70% 70–80% Giannoulias: 40–50% 50–60% 60–70% | |||||||||||||||||
| |||||||||||||||||


Incumbent Democrat Roland Burris did not run in 2010.[66] He suffered from poor approval ratings[67] and was investigated by the Sangamon County, Illinois State's Attorney for perjury.[68] Although no criminal charges were filed against him, he faced an investigation by the Senate Ethics Committee.[69]
There were two ballot items for the same seat: a regular election, to fill the Class 3 seat beginning with the 112th United States Congress beginning on January 3, 2011, and a special election, to fill that seat for the final weeks of the 111th Congress, replacing the temporary appointment of Roland Burris to the vacancy created by Barack Obama's election to the presidency.[70]
A federal court ruled that the candidates appearing on the ballot for the replacement election would be the ones of the regular election,[70][71] and that the special election would appear after the regular election on the ballot.[71]
As of 2023[update], this was the last Senate election in Illinois won by a Republican.
| Party | Candidate | Votes | % | |
|---|---|---|---|---|
| Democratic | Alexi Giannoulias | 351,120 | 38.9% | |
| Democratic | David Hoffman | 303,719 | 33.7% | |
| Democratic | Cheryle Jackson | 178,941 | 19.8% | |
| Democratic | Robert Marshall | 51,606 | 5.7% | |
| Democratic | Jacob Meister | 16,232 | 1.8% | |
| Total votes | 901,618 | 100.0% | ||
| Party | Candidate | Votes | % | |
|---|---|---|---|---|
| Republican | Mark Kirk | 420,373 | 56.6% | |
| Republican | Patrick Hughes | 142,928 | 19.3% | |
| Republican | Donald Lowery | 66,357 | 8.9% | |
| Republican | Kathleen Thomas | 54,038 | 7.3% | |
| Republican | Andy Martin | 37,480 | 5.0% | |
| Republican | John Arrington | 21,090 | 2.8% | |
| Republican | Patricia Beard | 2 | .0003% | |
| Total votes | 742,268 | 100.0% | ||
| Party | Candidate | Votes | % | |
|---|---|---|---|---|
| Republican | Mark Kirk | 1,677,729 | 47.3% | |
| Democratic | Alexi Giannoulias | 1,641,486 | 46.3% | |
| Green | LeAlan Jones | 129,571 | 3.7% | |
| Libertarian | Michael Labno | 95,762 | 2.7% | |
| Write-in | Lowell Martin Seida | 4 | 0.0001% | |
| Total votes | 3,545,984 | 100.00% | ||
| Party | Candidate | Votes | % | ±% | |
|---|---|---|---|---|---|
| Republican | Mark Kirk | 1,778,698 | 48.0% | +21.0% | |
| Democratic | Alexi Giannoulias | 1,719,478 | 46.4% | -25.6% | |
| Green | LeAlan Jones | 117,914 | 3.2% | N/A | |
| Libertarian | Michael Labno | 87,247 | 2.4% | +1.1% | |
| Write-in | Lowell Martin Seida | 4 | 0.0001% | N/A | |
| Write-ins | 1,136 | <0.1% | N/A | ||
| Majority | 59,220 | 1.6% | -51.4% | ||
| Turnout | 3,704,473 | -27.9% | |||
| Republican gain from Democratic | Swing | ||||
Indiana[edit]
| |||||||||||||||||||||||||||||||||||||
 County results Coats: 40–50% 50–60%. 60–70% 70–80% Ellsworth: 40–50% 50–60% | |||||||||||||||||||||||||||||||||||||
| |||||||||||||||||||||||||||||||||||||


Incumbent Democrat Evan Bayh decided in February 2010 to retire instead of seeking a third term shortly after former U.S. Senator Dan Coats announced his candidacy for Bayh's contested seat.[77] No Democratic candidate submitted enough signatures by the deadline to run, leading Democratic officials to choose U.S. Congressman Brad Ellsworth to be the nominee. Coats won the election.
| Party | Candidate | Votes | % | |
|---|---|---|---|---|
| Republican | Dan Coats | 217,225 | 39.5% | |
| Republican | Marlin Stutzman | 160,981 | 29.2% | |
| Republican | John Hostettler | 124,494 | 22.6% | |
| Republican | Don Bates, Jr. | 24,664 | 4.5% | |
| Republican | Richard Behney | 23,005 | 4.2% | |
| Total votes | 550,369 | 100.0% | ||
After Coats's win in the Republican primary, Ellsworth began to heavily criticize Coats for his ties to lobbyists. He called for more disclosure of the meetings lawmakers have with lobbyists, banning congressional staff from lobbying for six years after their congressional jobs, requiring Congress members to put all their investments in blind trusts, more disclosure of Senate candidates' personal financial information, and changes to the U.S. Senate filibuster rules. He proposed lowering number of votes required to break a filibuster to 55 from the current 60.[79] In response to Ellsworth's charges, Coats published his lobbying record in an 815-page document.
Coats emphasized the individual issues rather than ethics reforms advocated by his opponent. He focused on Ellsworth's record of voting in support of the Economic Stimulus Act of 2008, cap-and-trade legislation, and health care bill. Coats opinion of the healthcare law was that "the only responsible solution ... is to repeal the Obama-Pelosi-Ellsworth health spending bill and quickly replace it with cost-effective, incremental pieces that will decrease costs, increase coverage and not break the bank."
| Party | Candidate | Votes | % | ±% | |
|---|---|---|---|---|---|
| Republican | Dan Coats | 952,116 | 54.60% | +17.37% | |
| Democratic | Brad Ellsworth | 697,775 | 40.01% | -21.64% | |
| Libertarian | Rebecca Sink-Burris | 94,330 | 5.39% | +4.27% | |
| Majority | 254,341 | 14.58% | |||
| Total votes | 1,743,921 | 100.00% | |||
| Republican gain from Democratic | Swing | ||||
Iowa[edit]
| |||||||||||||||||
 County results Grassley: 50-60% 60-70% 70-80% 80-90% >90% Conlin: 50–60% | |||||||||||||||||
| |||||||||||||||||


Incumbent Republican Chuck Grassley won re-election to a sixth term.
| Party | Candidate | Votes | % | |
|---|---|---|---|---|
| Republican | Chuck Grassley (inc.) | 197,194 | 98.0% | |
| Republican | Write-ins | 3,926 | 2.0% | |
| Total votes | 201,120 | 100.0% | ||
| Party | Candidate | Votes | % | |
|---|---|---|---|---|
| Democratic | Roxanne Conlin | 52,715 | 77.5% | |
| Democratic | Bob Krause | 8,728 | 12.9% | |
| Democratic | Tom Fiegen | 6,357 | 9.4% | |
| Democratic | Write-ins | 177 | 0.2% | |
| Total votes | 67,977 | 100.0% | ||
Incumbent Chuck Grassley started the campaign moderately popular, but his approval ratings dropped somewhat during the campaign.[82] However, the seat continued to be considered to be "Safe Republican" by many sources, with CQ Politics noting that Grassley is "one of Iowa's most durable politicians."
Conlin described herself as a "prairie progressive." She supported the recent landmark case of Varnum v. Brien, which legalized gay marriage in the state. She also supported repeal of "don't ask, don't tell."[83]
Before the election, former political advisor John Maxwell claimed that Grassley would have his toughest race since his first U.S. Senate election in 1980, where he defeated incumbent John Culver with 53% of the vote. Grassley won all of his four re-election bids with nearly 70% of the vote against unknown opponents.[84] Grassley won the election with 64.51% of the vote.
| Party | Candidate | Votes | % | ±% | |
|---|---|---|---|---|---|
| Republican | Chuck Grassley (Incumbent) | 718,215 | 64.35% | -5.83% | |
| Democratic | Roxanne Conlin | 371,686 | 33.30% | +5.43% | |
| Libertarian | John Heiderscheit | 25,290 | 2.27% | ||
| Write-ins | 872 | 0.08% | |||
| Majority | 346,529 | 31.05% | -11.26% | ||
| Turnout | 1,116,063 | ||||
| Republican hold | Swing | ||||
Kansas[edit]
| |||||||||||||||||
 County results Moran: 50–60% 60–70% 70–80% 80–90% >90% Johnston: 40–50% 50–60% | |||||||||||||||||
| |||||||||||||||||


Incumbent Republican Sam Brownback retired to run for Governor of Kansas, instead of seeking a third term. Republican nominee Jerry Moran won the open seat. Kansas is one of the most Republican states in the nation;[citation needed] no Democrat has been elected to either Senate seat since 1932.
| Party | Candidate | Votes | % | |
|---|---|---|---|---|
| Democratic | Lisa Johnston | 25,421 | 31.2% | |
| Democratic | Charles Schollenberger | 19,228 | 23.6% | |
| Democratic | David Haley | 15,584 | 19.2% | |
| Democratic | Patrick Wiesner | 13,359 | 16.4% | |
| Democratic | Robert Conroy | 7,779 | 9.6% | |
| Total votes | 81,371 | 100.00% | ||
The retirement of Brownback, a popular U.S. Senator, led to a heavily competitive primary election. Tiahrt, who was on the Committee of Appropriations, had been accused of excessive earmarking while he was in Congress. From 2006 to 2008, Tiahrt had requested and supported a total of 63 solo earmarks, costing $53.9 million. In the same period, Moran had requested and supported a total of 29 earmarks, with a pricetag of $13.4 million.[87][88]
| Party | Candidate | Votes | % | |
|---|---|---|---|---|
| Republican | Jerry Moran | 161,407 | 49.8% | |
| Republican | Todd Tiahrt | 144,372 | 44.6% | |
| Republican | Tom Little | 10,104 | 3.1% | |
| Republican | Bob Londerholm | 8,168 | 2.5% | |
| Total votes | 324,051 | 100.00% | ||
After the primaries, Moran chose not to release any more negative advertisements. Democrat Lisa Johnston ran a low-profile, quiet race. On election day, she won only two counties: Wyandotte County and Douglas County, while Moran won statewide by a landslide.[89]
| Party | Candidate | Votes | % | ±% | |
|---|---|---|---|---|---|
| Republican | Jerry Moran | 578,768 | 70.34% | +1.18% | |
| Democratic | Lisa Johnston | 215,270 | 26.16% | -1.33% | |
| Libertarian | Michael Dann | 17,437 | 2.12% | +0.18% | |
| Reform | Joe Bellis | 11,356 | 1.38% | -0.04% | |
| Majority | 363,498 | 44.18% | |||
| Total votes | 822,831 | 100.00% | |||
| Republican hold | Swing | ||||
Kentucky[edit]
| |||||||||||||||||
 County results Paul: 50–60% 60–70% 70–80% Conway: 50–60% 60–70% Tie: 50% | |||||||||||||||||
| |||||||||||||||||

.jpg)
Incumbent Republican Jim Bunning retired instead of seeking a third term. Republican nominee Rand Paul won the open seat.[90]
On May 18, 2010, Paul won the Republican nomination.[90] After conceding the election to Paul, Grayson said, "It's time to put all differences aside, unite behind Dr. Paul, he needs our help and I for one stand ready to serve".[91]
| Party | Candidate | Votes | % | |
|---|---|---|---|---|
| Republican | Rand Paul | 206,986 | 58.8% | |
| Republican | Trey Grayson | 124,864 | 35.4% | |
| Republican | Bill Johnson | 7,861 | 2.2% | |
| Republican | John Stephenson | 6,885 | 2.0% | |
| Republican | Gurley L. Martin | 2,850 | 0.8% | |
| Republican | Jon J. Scribner | 2,829 | 0.8% | |
| Total votes | 352,275 | 100.0% | ||
| Party | Candidate | Votes | % | |
|---|---|---|---|---|
| Democratic | Jack Conway | 229,433 | 44.0% | |
| Democratic | Daniel Mongiardo | 225,260 | 43.2% | |
| Democratic | Darlene Fitzgerald Price | 28,531 | 5.5% | |
| Democratic | James Buckmaster | 20,561 | 3.9% | |
| Democratic | Maurice Sweeney | 17,874 | 3.4% | |
| Total votes | 521,659 | 100.0% | ||
Grayson attacked Paul for his "strange ideas," such as his opposition of the PATRIOT Act, and what Grayson alleged to be his support of closing down Guantanamo Bay and saying that Iran was not a threat. He also attacked Paul for being a Duke University fan.[relevant?] He sent out another TV ad and web video that stirred controversy by making the case that Paul believes that foreign policy decisions made prior to September 11, 2001, are partially to blame for the attacks.[93] Paul immediately responded by launching a statewide television ad in which he expresses his "outrage at terrorists who killed 3,000 innocents" before accusing Grayson of a "lie" and a "shameful" tactic.[94] Grayson accused the Fox News Channel of favoring Paul over him.
Conway began the race trailing Paul, but as he attacked his opponent's positions on social-welfare and criminal-justice policies, the polls began to tighten. The campaign attracted $8.5 million in contributions from outside groups, of which $6 million was spent to help Rand Paul and $2.5 million to help Conway. This money influx was in addition to the money spent by the candidates themselves: $6 million by Paul and $4.7 million by Conway.[95][96]
| Party | Candidate | Votes | % | ±% | |
|---|---|---|---|---|---|
| Republican | Rand Paul | 755,411 | 55.69% | +5.03% | |
| Democratic | Jack Conway | 599,617 | 44.26% | -5.12% | |
| Majority | 155,599 | 11.48% | |||
| Total votes | 1,354,833 | 100.00% | |||
| Republican hold | Swing | ||||
Louisiana[edit]
| |||||||||||||||||
 Parish results Vitter: 40-50% 50-60% 60–70% 70-80% Melançon: 40–50% 50–60% 70–80% | |||||||||||||||||
| |||||||||||||||||

.jpg)
Incumbent Republican David Vitter won re-election to a second term. Some speculated that Vitter's re-election might have become complicated, by the prostitution scandal revealed in 2007, but he continued to lead in aggregate polling against potential opponents.[97]
| Party | Candidate | Votes | % | |
|---|---|---|---|---|
| Democratic | Charlie Melançon | 77,702 | 70.6% | |
| Democratic | Neeson Chauvin | 19,507 | 17.7% | |
| Democratic | Cary Deaton | 12,842 | 11.7% | |
| Total votes | 110,051 | 100.0% | ||
| Party | Candidate | Votes | % | |
|---|---|---|---|---|
| Republican | David Vitter (Incumbent) | 85,179 | 87.6% | |
| Republican | Chet Traylor | 6,838 | 7.0% | |
| Republican | Nick Accardo | 5,221 | 5.4% | |
| Total votes | 97,238 | 100.0% | ||
Melançon heavily criticized Vitter for prostitution sex scandal.[99][100] Vitter released television advertising criticizing Melancon for his support for Obama's stimulus package and his support for amnesty for