2014 Swedish heatwave
 From Wikipedia the free encyclopedia
The summer of 2014 in Sweden was unusually warm, especially in the northern parts of the country. July was the warmest ever month on record in the north-west.[1]
Events[edit]
The July heat wave started after a week, when Härsnäs in Östergötland County recorded 30.1 °C (86.2 °F) after hot continental air came into the south of the country.[1] The southerly coastal areas recorded particularly warm nights, with Karlskrona recording a night minimum of 21.6 °C (70.9 °F) on 9 July.[1] The heat remained stabled and quite normal until the second half of the month, when heat warnings were released by the Meteorological Office.[1] The heat affected all of Sweden, but was particularly abnormally hot in the north. Tropical nights were recorded in the coastal north and by the Atlantic in the south on 22 and 23 July Umeå had its warmest temperature since 1882 with 32.2 °C (90.0 °F).[1] The temperature record of nearby islet Holmön was beaten by more than three degrees and topped 30.8 °C (87.4 °F) on an outlying island north of 63 degrees latitude.[1] Several thunderstorms struck the country in some areas at this time, with the precipitation being unevenly distributed. 67 millimetres (2.6 in) fell on the same day in Motala, whilst nearby Linköping only had 4 millimetres (0.16 in) of rainfall in all of July – akin to mediterranean climates. The highest figure was 76 millimetres (3.0 in) on the same day in Emmaboda in the southern inland areas.[1]
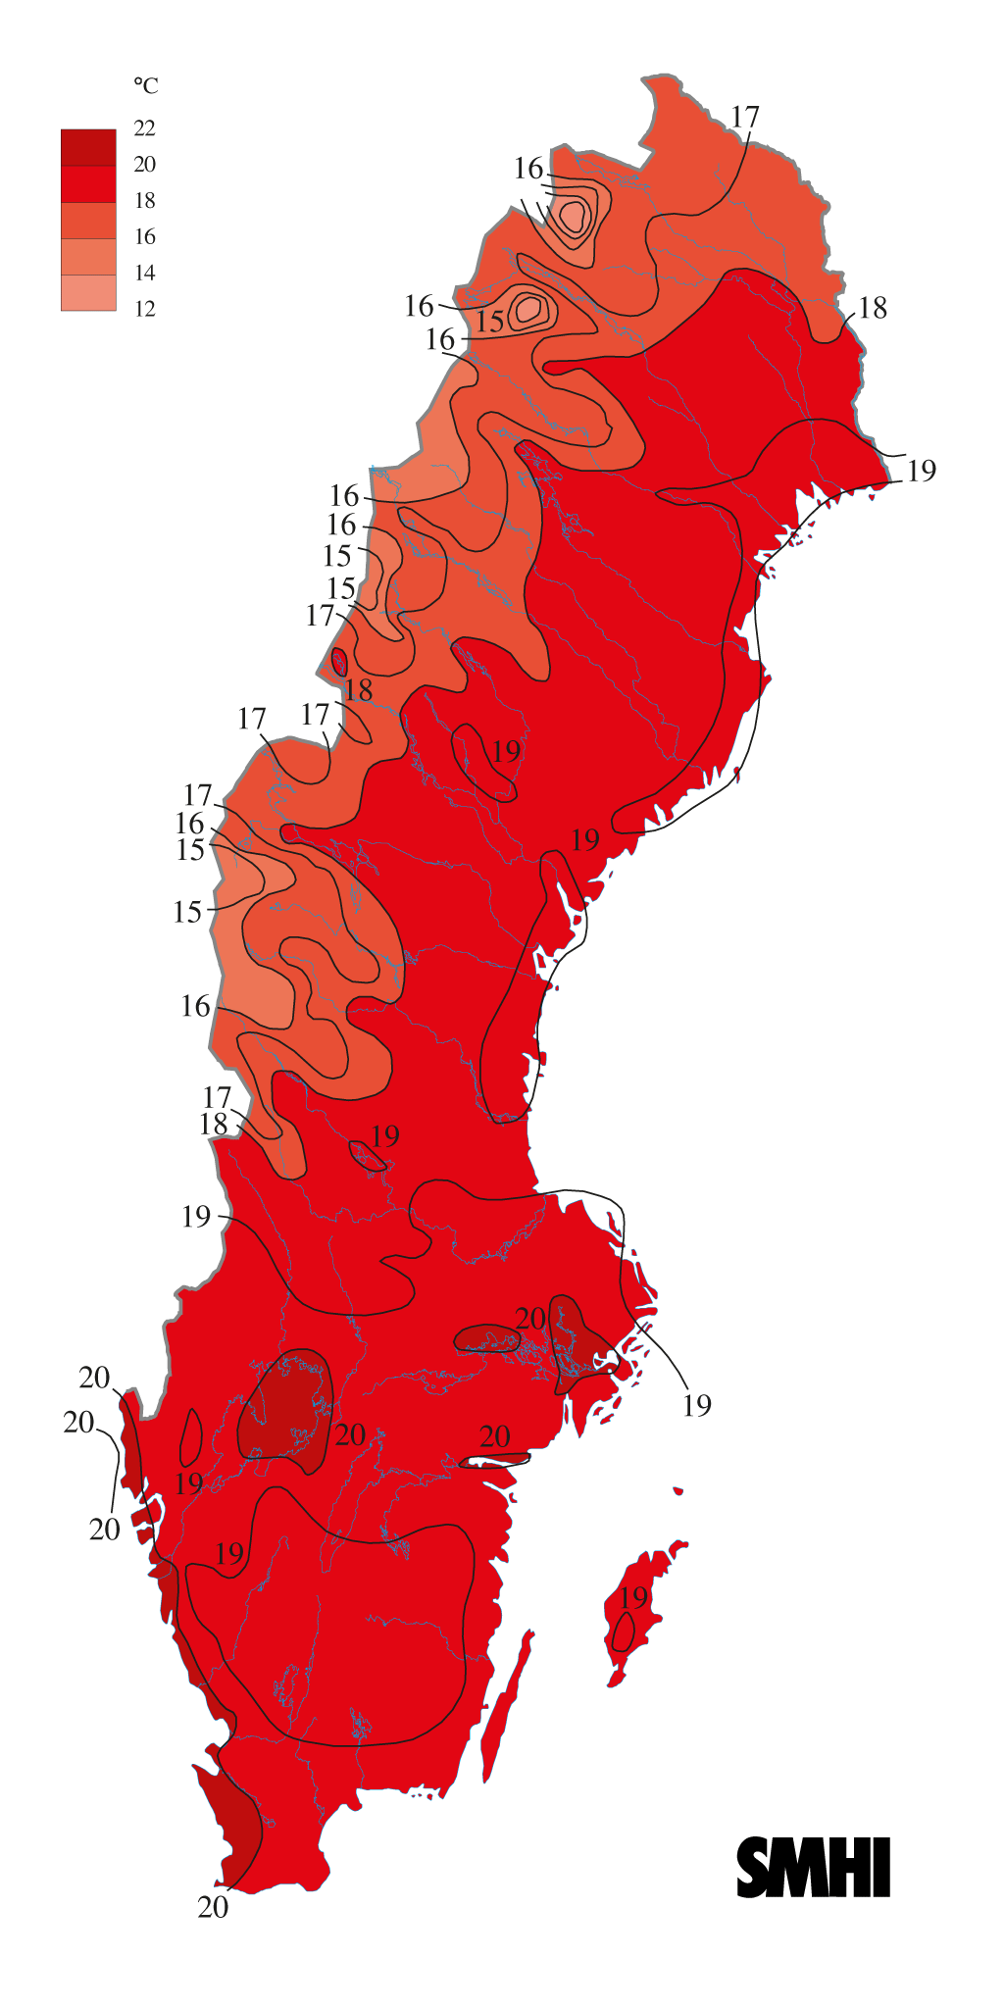
The temperatures started to rise to new exceptional levels the final week of July and first week of August. Small islets Storön and Rödkallen on the central Norrland coast had a night minimum at 22.6 °C (72.7 °F) on 26 July.[1] The intense sunshine and warm winds brought temperatures to 33.9 °C (93.0 °F) in Hökmarksberget in Skellefteå Municipality the following day, with even a marine station (Bjuröklubb) going above 32 °C (90 °F) for the first time ever.[1] As seen in this official picture, temperatures were a lot warmer than usual with daily means being above 20 °C (68 °F) in the most southerly areas, with temperatures approaching such means even far north.[2] Even gloomy mountain areas such as Östersund and Storlien had warm months.[1] Although the temperatures in the mountain ranges topped 23 °C (73 °F) on average, more significant though was that both locations significantly bettered the July sunshine records.[3]
In August the heat wave in the far north got somewhat tempered, but for the first week the heatwave got new proportions in the southern and central parts of Sweden. After a few relatively calm days around 25 °C (77 °F) a high-pressure system originating in the Baltic states came into the eastern parts of the country on 3 August, ensuring new nationwide high temperatures for the heatwave, although not matching the historic all-time highs. Härsnäs once again tied for warmest in the country with 33.9 °C (93.0 °F), matching the values from Renbergsvattnet.[4] 4 August was the hottest day of the year and for a few years before when far inland town Falun recorded 35.1 °C (95.2 °F),[4] Other areas got affected by thunderstorms moderating temperatures the same day, but Örebro recorded 33.7 °C (92.7 °F) – the highest temperature in that city for decades, as well as Uppsala setting a new August record with 33.3 °C (91.9 °F).[5] The highest overnight low was reached on 3 August on the uninhabited isolated island of Gotska Sandön with 23.6 °C (74.5 °F) a mere 0.1 °C below the nationwide all-time record for warmest low.[4]
Following this event, the heat cooled off and August in general was quite normal in terms of temperatures, with plentiful of precipitation. The warm waters surrounding Sweden during the autumn still led to thunderstorms happening as late as early November, something that is highly unusual.[6]
Milestones[edit]
Several heat records were broken and the summer was unusually warm by such northerly marine standards. Apart from in neighbouring countries the heatwave was very much localised, and average temperatures were somewhat neutered by cooler spells interrupting the various intense bursts of heat, as well as the cool nights in Sweden that bring average temperatures down. In a Swedish context this was still a remarkable event, in particular the extremely warm temperatures far north. Small village Kvikkjokk north of the Arctic Circle had a July average high of 25.4 °C (77.7 °F) and Luleå had a daily mean of 19.5 °C (67.1 °F) in a coastal location north of the 65th parallel.[7] Sweden's second city Gothenburg tied for the warmest July month on record with a high of 26.2 °C (79.2 °F), a low of 16.3 °C (61.3 °F) and a resulting mean of 21.2 °C (70.2 °F). Gothenburg's mean was the warmest in the country, but the warmest high mean was 27 °C (81 °F) in Falun.[7] The all-time record of the 21.9 °C (71.4 °F) mean for Linköping a 100 years earlier did however stand. A July average low of 17.9 °C (64.2 °F) was measured at Måseskär off the west coast, where temperatures never fell below 14.4 °C (57.9 °F) all month.[7]
The warm and dry local weather also contributed to intense wildfires in Västmanland County in early August that took several weeks to get under proper control.[4]
With the heat wave as a contributing factor along with the following mild autumn, 2014 was the warmest year on record in Stockholm, Gothenburg and Malmö – the three largest cities in the country. The yearly mean of 10.4 °C (50.7 °F) in Falsterbo was also the highest on record for the official stations mentioned every month in SMHI's data report. Lund recorded an average year high of 13.9 °C (57.0 °F).[8] Among other unusual consequences of the heat wave was that Kiruna had a yearly mean of just above the freezing point, and Luleå's mean topping 4 °C (39 °F) for the first time.
Regions[edit]
This section possibly contains original research. (July 2018) |
This section is written like a personal reflection, personal essay, or argumentative essay that states a Wikipedia editor's personal feelings or presents an original argument about a topic. (July 2018) |
Skåne[edit]
Skanör med Falsterbo set a new Swedish record for warmest yearly mean with 10.4 °C (50.7 °F). Its marine features rendered less severe daytime heat during the heat wave, but rather very warm nights. Daily July means went above 20 °C (68 °F), but the temperature record and individual monthly record both stood, with Falsterbo only once recording 30 °C (86 °F) in its recorded history (as of 2016). In spite of the hypermarine features of the climate Falsterbo recorded 20 days above 25 °C (77 °F) during the summer.[9] In the wake of the heat wave Falsterbo had an October average low of the very mild 11.3 °C (52.3 °F).
| Climate data for Falsterbo (2014 values only) | |||||||||||||
|---|---|---|---|---|---|---|---|---|---|---|---|---|---|
| Month | Jan | Feb | Mar | Apr | May | Jun | Jul | Aug | Sep | Oct | Nov | Dec | Year |
| Record high °C (°F) | 7.8 (46.0) | 6.3 (43.3) | 11.7 (53.1) | 18.6 (65.5) | 20.6 (69.1) | 22.6 (72.7) | 28.8 (83.8) | 26.9 (80.4) | 20.3 (68.5) | 17.7 (63.9) | 14.3 (57.7) | 8.7 (47.7) | 28.8 (83.8) |
| Mean daily maximum °C (°F) | 2.9 (37.2) | 4.4 (39.9) | 7.5 (45.5) | 11.4 (52.5) | 15.3 (59.5) | 19.6 (67.3) | 24.1 (75.4) | 20.7 (69.3) | 18.1 (64.6) | 14.4 (57.9) | 9.7 (49.5) | 5.3 (41.5) | 12.7 (54.9) |
| Daily mean °C (°F) | 1.8 (35.2) | 3.0 (37.4) | 5.1 (41.2) | 8.4 (47.1) | 12.1 (53.8) | 15.9 (60.6) | 20.1 (68.2) | 17.7 (63.9) | 15.3 (59.5) | 12.9 (55.2) | 8.5 (47.3) | 3.9 (39.0) | 10.4 (50.7) |
| Mean daily minimum °C (°F) | 0.7 (33.3) | 1.8 (35.2) | 3.1 (37.6) | 5.8 (42.4) | 9.7 (49.5) | 12.7 (54.9) | 16.8 (62.2) | 15.4 (59.7) | 12.8 (55.0) | 11.3 (52.3) | 7.5 (45.5) | 2.4 (36.3) | 8.3 (46.9) |
| Record low °C (°F) | −6.2 (20.8) | −1.8 (28.8) | 0.1 (32.2) | 2.0 (35.6) | 5.9 (42.6) | 9.7 (49.5) | 13.4 (56.1) | 10.5 (50.9) | 6.0 (42.8) | 5.8 (42.4) | 1.6 (34.9) | −7.9 (17.8) | −7.9 (17.8) |
| Average precipitation mm (inches) | 32 (1.3) | 37 (1.5) | 19 (0.7) | 33 (1.3) | 34 (1.3) | 23 (0.9) | 47 (1.9) | 182 (7.2) | 57 (2.2) | 93 (3.7) | 29 (1.1) | 68 (2.7) | 654 (25.7) |
| Mean monthly sunshine hours | 13 | 81 | 153 | 206 | 276 | 281 | 323 | 249 | 197 | 79 | 38 | 38 | 1,934 |
| Source 1: SMHI[10] | |||||||||||||
| Source 2: SMHI Monthly Data 2002-2015[11] | |||||||||||||
| Climate data for Falsterbo (2002-2015 temperatures; 1961-1990 precipitation and sunshine) | |||||||||||||
|---|---|---|---|---|---|---|---|---|---|---|---|---|---|
| Month | Jan | Feb | Mar | Apr | May | Jun | Jul | Aug | Sep | Oct | Nov | Dec | Year |
| Mean daily maximum °C (°F) | 2.8 (37.0) | 2.4 (36.3) | 5.2 (41.4) | 10.0 (50.0) | 14.9 (58.8) | 18.5 (65.3) | 21.6 (70.9) | 21.0 (69.8) | 17.5 (63.5) | 12.2 (54.0) | 8.1 (46.6) | 4.7 (40.5) | 11.5 (52.7) |
| Mean daily minimum °C (°F) | −0.1 (31.8) | −0.4 (31.3) | 1.0 (33.8) | 4.4 (39.9) | 8.8 (47.8) | 12.4 (54.3) | 15.4 (59.7) | 15.5 (59.9) | 12.5 (54.5) | 8.4 (47.1) | 5.3 (41.5) | 1.9 (35.4) | 7.0 (44.6) |
| Average precipitation mm (inches) | 36.4 (1.43) | 24.6 (0.97) | 32.3 (1.27) | 34.8 (1.37) | 37.7 (1.48) | 43.9 (1.73) | 51.6 (2.03) | 50.0 (1.97) | 46.0 (1.81) | 46.3 (1.82) | 45.7 (1.80) | 41.1 (1.62) | 490.6 (19.31) |
| Mean monthly sunshine hours | 30 | 55 | 95 | 175 | 255 | 255 | 250 | 245 | 145 | 105 | 60 | 30 | 1,700 |
| Source 1: SMHI[12] | |||||||||||||
| Source 2: SMHI Monthly Data 2002-2015[11] | |||||||||||||
Lund in Skåne had its warmest year on record, but its extremely warm July still did not match its 2006 record for the warmest month. Lund recorded 33 days with temperatures above 25 °C (77 °F).[9] Its July mean of 20.8 °C (69.4 °F) was also the warmest in the country, due to the very warm nights by Swedish standards, averaging around 16 °C (61 °F). Unlike areas further north, Lund did not experience a summer drought.
| Climate data for Lund (2014 values only) | |||||||||||||
|---|---|---|---|---|---|---|---|---|---|---|---|---|---|
| Month | Jan | Feb | Mar | Apr | May | Jun | Jul | Aug | Sep | Oct | Nov | Dec | Year |
| Record high °C (°F) | 8.6 (47.5) | 9.1 (48.4) | 17.1 (62.8) | 21.0 (69.8) | 26.6 (79.9) | 27.7 (81.9) | 31.1 (88.0) | 30.7 (87.3) | 24.1 (75.4) | 18.9 (66.0) | 14.7 (58.5) | 9.8 (49.6) | 31.1 (88.0) |
| Mean daily maximum °C (°F) | 2.5 (36.5) | 6.1 (43.0) | 9.9 (49.8) | 13.9 (57.0) | 17.7 (63.9) | 20.7 (69.3) | 25.9 (78.6) | 21.7 (71.1) | 19.3 (66.7) | 14.4 (57.9) | 9.3 (48.7) | 4.8 (40.6) | 13.8 (56.8) |
| Daily mean °C (°F) | 1.1 (34.0) | 3.4 (38.1) | 5.6 (42.1) | 9.1 (48.4) | 12.8 (55.0) | 15.8 (60.4) | 20.8 (69.4) | 17.0 (62.6) | 15.1 (59.2) | 11.7 (53.1) | 7.5 (45.5) | 2.7 (36.9) | 10.2 (50.4) |
| Mean daily minimum °C (°F) | −0.3 (31.5) | 1.5 (34.7) | 2.0 (35.6) | 4.9 (40.8) | 8.7 (47.7) | 11.1 (52.0) | 15.9 (60.6) | 12.9 (55.2) | 11.5 (52.7) | 9.4 (48.9) | 6.2 (43.2) | 0.7 (33.3) | 7.0 (44.6) |
| Record low °C (°F) | −8.1 (17.4) | −2.3 (27.9) | −1.6 (29.1) | −0.9 (30.4) | 1.1 (34.0) | 7.0 (44.6) | 9.8 (49.6) | 7.1 (44.8) | 0.0 (32.0) | 1.8 (35.2) | 0.7 (33.3) | −9.1 (15.6) | −9.1 (15.6) |
| Average precipitation mm (inches) | 61 (2.4) | 56 (2.2) | 30 (1.2) | 28 (1.1) | 73 (2.9) | 40 (1.6) | 57 (2.2) | 140 (5.5) | 29 (1.1) | 140 (5.5) | 27 (1.1) | 120 (4.7) | 801 (31.5) |
| Mean monthly sunshine hours | 8 | 65 | 164 | 219 | 252 | 267 | 332 | 220 | 200 | 71 | 30 | 29 | 1,857 |
| Source 1: SMHI Average Precipitation 1961-1990[13] | |||||||||||||
| Source 2: SMHI Average Data 2002-2015[14] | |||||||||||||
| Climate data for Lund 2002-2015; precipitation 1961-1990 | |||||||||||||
|---|---|---|---|---|---|---|---|---|---|---|---|---|---|
| Month | Jan | Feb | Mar | Apr | May | Jun | Jul | Aug | Sep | Oct | Nov | Dec | Year |
| Mean daily maximum °C (°F) | 2.5 (36.5) | 2.9 (37.2) | 7.1 (44.8) | 13.3 (55.9) | 17.7 (63.9) | 20.6 (69.1) | 23.8 (74.8) | 22.7 (72.9) | 18.6 (65.5) | 12.6 (54.7) | 7.8 (46.0) | 4.2 (39.6) | 12.8 (55.0) |
| Mean daily minimum °C (°F) | −1.6 (29.1) | −1.6 (29.1) | −0.2 (31.6) | 3.6 (38.5) | 7.8 (46.0) | 11.1 (52.0) | 13.9 (57.0) | 13.8 (56.8) | 10.4 (50.7) | 6.1 (43.0) | 3.4 (38.1) | 0.1 (32.2) | 5.5 (41.9) |
| Average precipitation mm (inches) | 54.4 (2.14) | 33.1 (1.30) | 45.0 (1.77) | 40.3 (1.59) | 44.5 (1.75) | 55.5 (2.19) | 69.7 (2.74) | 64.6 (2.54) | 64.2 (2.53) | 60.4 (2.38) | 68.9 (2.71) | 65.3 (2.57) | 665.8 (26.21) |
| Mean monthly sunshine hours | 37 | 64 | 105 | 166 | 231 | 235 | 223 | 212 | 141 | 94 | 52 | 32 | 1,592 |
| Source 1: SMHI Average Precipitation 1961-1990[13] | |||||||||||||
| Source 2: SMHI Average Data 2002-2015[14] | |||||||||||||
Eastern Götaland[edit]
Norrköping and the surrounding coastline through Västervik to the south Nyköping to the east had a very warm summer in spite of the near-coastal location. Norrköping had a yearly mean of 8.7 °C (47.7 °F), a new all-time record. Although the year was record warm, July did not beat the 1994 records, but it was still far warmer than a normal year. In total, 32 days of the year reached 25 °C (77 °F) in Norrköping.[9]
| Climate data for Norrköping (2014 values only) | |||||||||||||
|---|---|---|---|---|---|---|---|---|---|---|---|---|---|
| Month | Jan | Feb | Mar | Apr | May | Jun | Jul | Aug | Sep | Oct | Nov | Dec | Year |
| Mean daily maximum °C (°F) | 0.1 (32.2) | 4.2 (39.6) | 9.2 (48.6) | 13.3 (55.9) | 16.6 (61.9) | 19.7 (67.5) | 25.7 (78.3) | 21.8 (71.2) | 17.8 (64.0) | 12.6 (54.7) | 6.9 (44.4) | 2.5 (36.5) | 12.5 (54.5) |
| Mean daily minimum °C (°F) | −3.2 (26.2) | 0.5 (32.9) | 0.7 (33.3) | 2.1 (35.8) | 6.6 (43.9) | 9.7 (49.5) | 14.1 (57.4) | 11.8 (53.2) | 8.4 (47.1) | 6.9 (44.4) | 3.7 (38.7) | −2.2 (28.0) | 4.9 (40.8) |
| Average precipitation mm (inches) | 69 (2.7) | 49 (1.9) | 42 (1.7) | 33 (1.3) | 67 (2.6) | 77 (3.0) | 15 (0.6) | 47 (1.9) | 47 (1.9) | 78 (3.1) | 46 (1.8) | 36 (1.4) | 606 (23.9) |
| Mean monthly sunshine hours | 20 | 31 | 173 | 267 | 241 | 250 | 344 | 207 | 192 | 66 | 25 | 44 | 1,860 |
| Source: SMHI Monthly Data 2002-2015[15] | |||||||||||||
| Climate data for Norrköping (2002-2015 temperatures; 1961-1990 precipitation & sunshine) | |||||||||||||
|---|---|---|---|---|---|---|---|---|---|---|---|---|---|
| Month | Jan | Feb | Mar | Apr | May | Jun | Jul | Aug | Sep | Oct | Nov | Dec | Year |
| Mean daily maximum °C (°F) | 0.8 (33.4) | 1.2 (34.2) | 5.6 (42.1) | 12.0 (53.6) | 16.7 (62.1) | 20.4 (68.7) | 23.1 (73.6) | 21.8 (71.2) | 17.5 (63.5) | 10.7 (51.3) | 5.8 (42.4) | 2.5 (36.5) | 11.5 (52.7) |
| Mean daily minimum °C (°F) | −4.3 (24.3) | −4.4 (24.1) | −2.5 (27.5) | 1.4 (34.5) | 6.1 (43.0) | 10.0 (50.0) | 13.3 (55.9) | 12.4 (54.3) | 8.6 (47.5) | 3.8 (38.8) | 1.1 (34.0) | −2.3 (27.9) | 3.7 (38.7) |
| Average precipitation mm (inches) | 31.7 (1.25) | 23.1 (0.91) | 27.3 (1.07) | 29.7 (1.17) | 36.4 (1.43) | 49.7 (1.96) | 61.9 (2.44) | 59.0 (2.32) | 55.3 (2.18) | 47.3 (1.86) | 47.7 (1.88) | 38.9 (1.53) | 508.2 (20.01) |
| Mean monthly sunshine hours | 40 | 70 | 100 | 175 | 259 | 277 | 253 | 222 | 149 | 96 | 57 | 36 | 1,734 |
| Source 1: SMHI[16] | |||||||||||||
| Source 2: SMHI Monthly Data 2002-2015[17] | |||||||||||||
Svealand[edit]
Falun in Dalarna saw the warmest temperature of the year in the country with 35 °C (95 °F) in early August. Its July was also the hottest in Sweden during daytime. July was so dry that it could easily be compared to mediterranean climates. August compensated for that with heavy rainfall.
| Climate data for Falun (2014 values only) | |||||||||||||
|---|---|---|---|---|---|---|---|---|---|---|---|---|---|
| Month | Jan | Feb | Mar | Apr | May | Jun | Jul | Aug | Sep | Oct | Nov | Dec | Year |
| Record high °C (°F) | 5.8 (42.4) | 7.6 (45.7) | 17.5 (63.5) | 22.3 (72.1) | 28.7 (83.7) | 27.0 (80.6) | 33.3 (91.9) | 35.1 (95.2) | 23.5 (74.3) | 15.5 (59.9) | 12.0 (53.6) | 4.9 (40.8) | 35.1 (95.2) |
| Mean daily maximum °C (°F) | −2.8 (27.0) | 2.1 (35.8) | 7.8 (46.0) | 12.9 (55.2) | 16.1 (61.0) | 19.2 (66.6) | 27.0 (80.6) | 21.5 (70.7) | 18.0 (64.4) | 9.9 (49.8) | 4.2 (39.6) | −0.8 (30.6) | 11.2 (52.2) |
| Daily mean °C (°F) | −4.6 (23.7) | 0.6 (33.1) | 3.3 (37.9) | 6.7 (44.1) | 10.8 (51.4) | 13.7 (56.7) | 20.4 (68.7) | 15.9 (60.6) | 11.9 (53.4) | 7.2 (45.0) | 2.6 (36.7) | −3.5 (25.7) | 7.1 (44.8) |
| Mean daily minimum °C (°F) | −6.4 (20.5) | −1.1 (30.0) | −0.5 (31.1) | 0.3 (32.5) | 5.7 (42.3) | 8.5 (47.3) | 13.5 (56.3) | 10.8 (51.4) | 6.3 (43.3) | 4.4 (39.9) | 1.0 (33.8) | −6.5 (20.3) | 3.0 (37.4) |
| Record low °C (°F) | −15.9 (3.4) | −8.1 (17.4) | −7.1 (19.2) | −5.8 (21.6) | −3.3 (26.1) | 2.8 (37.0) | 7.3 (45.1) | 4.6 (40.3) | −0.2 (31.6) | −4.2 (24.4) | −6.0 (21.2) | −16.5 (2.3) | −16.5 (2.3) |
| Average precipitation mm (inches) | 38 (1.5) | 52 (2.0) | 37 (1.5) | 35 (1.4) | 38 (1.5) | 56 (2.2) | 14 (0.6) | 118 (4.6) | 24 (0.9) | 140 (5.5) | 46 (1.8) | 15 (0.6) | 613 (24.1) |
| Source: SMHI average data 2002-2015[18] | |||||||||||||
| Climate data for Falun (2002-2015 temperatures; 1961-1990 precipitation) | |||||||||||||
|---|---|---|---|---|---|---|---|---|---|---|---|---|---|
| Month | Jan | Feb | Mar | Apr | May | Jun | Jul | Aug | Sep | Oct | Nov | Dec | Year |
| Mean daily maximum °C (°F) | −1.8 (28.8) | −0.6 (30.9) | 4.5 (40.1) | 11.3 (52.3) | 16.4 (61.5) | 20.7 (69.3) | 23.4 (74.1) | 21.5 (70.7) | 16.2 (61.2) | 8.6 (47.5) | 3.4 (38.1) | −0.2 (31.6) | 10.2 (50.4) |
| Mean daily minimum °C (°F) | −7.7 (18.1) | −7.4 (18.7) | −4.8 (23.4) | −0.1 (31.8) | 4.8 (40.6) | 9.0 (48.2) | 12.1 (53.8) | 11.0 (51.8) | 6.8 (44.2) | 1.6 (34.9) | −1.7 (28.9) | −5.9 (21.4) | 1.4 (34.5) |
| Average precipitation mm (inches) | 40.6 (1.60) | 28.2 (1.11) | 32.0 (1.26) | 38.2 (1.50) | 44.8 (1.76) | 58.1 (2.29) | 76.0 (2.99) | 79.3 (3.12) | 70.6 (2.78) | 53.1 (2.09) | 55.2 (2.17) | 40.8 (1.61) | 616.9 (24.29) |
| Source 1: SMHI Precipitation normals 1961-1990[19] | |||||||||||||
| Source 2: SMHI average data 2002-2015[20] | |||||||||||||
Örebro, (namesake county) had a very warm year with uneven precipitation patterns, with a summer drought and heavy rainfall in many other parts of the year.
| Climate data for Örebro Airport (2014 values only) | |||||||||||||
|---|---|---|---|---|---|---|---|---|---|---|---|---|---|
| Month | Jan | Feb | Mar | Apr | May | Jun | Jul | Aug | Sep | Oct | Nov | Dec | Year |
| Mean daily maximum °C (°F) | −0.5 (31.1) | 3.9 (39.0) | 8.9 (48.0) | 13.6 (56.5) | 16.6 (61.9) | 20.0 (68.0) | 26.0 (78.8) | 21.5 (70.7) | 18.0 (64.4) | 12.3 (54.1) | 6.5 (43.7) | 2.7 (36.9) | 12.4 (54.3) |
| Mean daily minimum °C (°F) | −4.1 (24.6) | 0.2 (32.4) | 0.7 (33.3) | 1.6 (34.9) | 6.1 (43.0) | 9.3 (48.7) | 13.5 (56.3) | 10.3 (50.5) | 6.3 (43.3) | 5.3 (41.5) | 3.1 (37.6) | −3.1 (26.4) | 4.1 (39.4) |
| Average precipitation mm (inches) | 83 (3.3) | 65 (2.6) | 39 (1.5) | 53 (2.1) | 73 (2.9) | 96 (3.8) | 23 (0.9) | 83 (3.3) | 35 (1.4) | 97 (3.8) | 55 (2.2) | 19 (0.7) | 721 (28.4) |
| Source: SMHI average data 2002-2015[21] | |||||||||||||
| Climate data for Örebro Airport (2002-2015 temperatures and 1961-1990 precipitation normals) | |||||||||||||
|---|---|---|---|---|---|---|---|---|---|---|---|---|---|
| Month | Jan | Feb | Mar | Apr | May | Jun | Jul | Aug | Sep | Oct | Nov | Dec | Year |
| Mean daily maximum °C (°F) | 0.3 (32.5) | 0.7 (33.3) | 5.4 (41.7) | 12.1 (53.8) | 16.9 (62.4) | 20.6 (69.1) | 23.1 (73.6) | 21.8 (71.2) | 17.2 (63.0) | 10.3 (50.5) | 5.3 (41.5) | 1.9 (35.4) | 11.3 (52.3) |
| Mean daily minimum °C (°F) | −5.6 (21.9) | −5.4 (22.3) | −3.2 (26.2) | 1.0 (33.8) | 5.7 (42.3) | 9.4 (48.9) | 12.5 (54.5) | 11.2 (52.2) | 7.3 (45.1) | 2.7 (36.9) | 0.5 (32.9) | −3.6 (25.5) | 2.7 (36.9) |
| Average precipitation mm (inches) | 48.4 (1.91) | 34.9 (1.37) | 35.8 (1.41) | 40.1 (1.58) | 43.7 (1.72) | 55.5 (2.19) | 76.2 (3.00) | 74.3 (2.93) | 74.5 (2.93) | 62.3 (2.45) | 65.6 (2.58) | 50.1 (1.97) | 661.4 (26.04) |
| Source 1: SMHI Precipitation normals 1961-1990[22] | |||||||||||||
| Source 2: SMHI average data 2002-2015[23] | |||||||||||||
Northern Norrland[edit]
Luleå (Norrbotten), recorded the warmest month in Northern Norrland since 1925 with a July mean of 19.5 °C (67.1 °F). Considering the airport being in a rural setting, the urban area may well have surpassed Haparanda's 1925 19.6 °C (67.3 °F) reading. In spite of the high means a mere 14 days above 25 °C (77 °F) was recorded in Luleå.[9] The warm temperatures both in July means and yearly means were due to the mild summer nights by the coastline.
Lycksele saw a record warm summer with an extremely hot July considering its northerly latitude with summer highs approaching 26 °C (79 °F). As many as 31 days reached or went above 25 °C (77 °F).[9]
| Climate data for Lycksele (2014 values only) | |||||||||||||
|---|---|---|---|---|---|---|---|---|---|---|---|---|---|
| Month | Jan | Feb | Mar | Apr | May | Jun | Jul | Aug | Sep | Oct | Nov | Dec | Year |
| Mean daily maximum °C (°F) | −8.3 (17.1) | 0.3 (32.5) | 3.5 (38.3) | 8.3 (46.9) | 13.7 (56.7) | 17.9 (64.2) | 25.9 (78.6) | 19.9 (67.8) | 15.3 (59.5) | 5.0 (41.0) | 0.0 (32.0) | −2.1 (28.2) | 8.2 (46.8) |
| Mean daily minimum °C (°F) | −15.3 (4.5) | −3.5 (25.7) | −4.6 (23.7) | −2.9 (26.8) | 1.0 (33.8) | 6.0 (42.8) | 10.7 (51.3) | 9.1 (48.4) | 1.8 (35.2) | −0.7 (30.7) | −6.2 (20.8) | −12.0 (10.4) | −1.3 (29.7) |
| Average precipitation mm (inches) | 14 (0.6) | 22 (0.9) | 17 (0.7) | 3 (0.1) | 43 (1.7) | 45 (1.8) | 38 (1.5) | 89 (3.5) | 13 (0.5) | 60 (2.4) | 19 (0.7) | 23 (0.9) | 386 (15.2) |
| Source: SMHI climate data 2002-2015[24] | |||||||||||||
| Climate data for Lycksele (temperature 2002-2015; precipitation 1961-1990; extremes since 1945) | |||||||||||||
|---|---|---|---|---|---|---|---|---|---|---|---|---|---|
| Month | Jan | Feb | Mar | Apr | May | Jun | Jul | Aug | Sep | Oct | Nov | Dec | Year |
| Mean daily maximum °C (°F) | −5.8 (21.6) | −4.1 (24.6) | 1.3 (34.3) | 7.3 (45.1) | 13.7 (56.7) | 18.3 (64.9) | 21.5 (70.7) | 19.5 (67.1) | 13.8 (56.8) | 5.7 (42.3) | −0.3 (31.5) | −3.4 (25.9) | 7.2 (45.0) |
| Mean daily minimum °C (°F) | −15.7 (3.7) | −15.0 (5.0) | −10.3 (13.5) | −3.7 (25.3) | 1.3 (34.3) | 6.1 (43.0) | 9.5 (49.1) | 7.8 (46.0) | 3.4 (38.1) | −1.8 (28.8) | −7.3 (18.9) | −12.5 (9.5) | −3.1 (26.4) |
| Average precipitation mm (inches) | 29.6 (1.17) | 22.0 (0.87) | 25.0 (0.98) | 23.9 (0.94) | 29.1 (1.15) | 37.7 (1.48) | 62.1 (2.44) | 55.7 (2.19) | 47.0 (1.85) | 39.7 (1.56) | 39.8 (1.57) | 31.3 (1.23) | 442.9 (17.44) |
| Source 1: SMHI precipitation average 1961-1990[25] | |||||||||||||
| Source 2: SMHI climate data 2002-2015[26] | |||||||||||||
References[edit]
- ^ a b c d e f g h i j "Monthly Weather July 2014" (in Swedish). SMHI. Archived from the original on 9 June 2015. Retrieved 2 November 2015.
- ^ "Average temperature map for July 2014" (in Swedish). SMHI. Retrieved 2 November 2015.
- ^ "Precipitation & Sunshine for July 2014" (PDF) (in Swedish). SMHI. Retrieved 6 November 2015.
- ^ a b c d "Weather August 2014" (in Swedish). SMHI. Archived from the original on 9 June 2015. Retrieved 2 November 2015.
- ^ "Temperature & Wind August 2014" (PDF) (in Swedish). SMHI. Retrieved 2 November 2015.
- ^ "The crazy November weather - Record heat and Thunder" (in Swedish). EWP.se. Retrieved 20 February 2015.
- ^ a b c "Temperature & Wind for July" (PDF) (in Swedish). SMHI. Retrieved 2 November 2015.
- ^ "Temperature averages for 2014" (PDF) (in Swedish). SMHI. Retrieved 6 November 2015.
- ^ a b c d e "Temperature summary for 2014" (PDF) (in Swedish). SMHI. Retrieved 18 July 2016.
- ^ "Precipitation Normals 1961-1990" (in Swedish). Swedish Metereological and Hydrological Institute (Falsterbo code 5223). Archived from the original on 2018-09-28. Retrieved 2016-07-18.
- ^ a b "Monthly and Yearly Statistics (Swedish)". SMHI. April 9, 2016. Archived from the original on May 2, 2019. Retrieved July 17, 2016.
- ^ "Precipitation Normals 1961-1990" (in Swedish). Swedish Metereological and Hydrological Institute (Falsterbo code 5223). Archived from the original on 2018-09-28. Retrieved 2016-07-18.
- ^ a b "Precipitation Averages 1961-1990". SMHI. April 2015. Archived from the original on 28 September 2018. Retrieved 21 April 2015.
- ^ a b "Statistics from Weather Stations (Swedish)". SMHI. March 2016. Archived from the original on 2 May 2019. Retrieved 18 March 2016.
- ^ "SMHI Monthly Data 2002-2015". SMHI. February 22, 2015. Archived from the original on May 2, 2019. Retrieved July 17, 2016.
- ^ "Precipitation 1961-1990". Swedish Metereological and Hydrological Institute (Norrköping code 8636). Archived from the original on 2018-09-28. Retrieved 2016-07-18.
- ^ "Smhi.se". SMHI. February 22, 2015. Archived from the original on May 2, 2019. Retrieved July 17, 2016.
- ^ "Average monthly & yearly statistics". SMHI. 18 July 2016. Archived from the original on 2 May 2019. Retrieved 17 July 2016.
- ^ "Precipitation normals 1961-1990" (in Swedish). Swedish Metereological and Hydrological Institute (Falun code 10 537). Archived from the original on 2018-05-02. Retrieved 2016-07-17.
- ^ "Smhi.se". SMHI. 18 July 2016. Archived from the original on 2 May 2019. Retrieved 17 July 2016.
- ^ "Annual and Monthly Statistics". SMHI. 17 July 2016. Archived from the original on 2 May 2019. Retrieved 17 July 2016.
- ^ "Average Precipitation for Stations (Swedish)". Swedish Metereological and Hydrological Institute (Örebro code 9562). Archived from the original on 2 May 2018. Retrieved 20 February 2015.
- ^ "Annual and Monthly Statistics". SMHI. 9 January 2016. Archived from the original on 2 May 2019. Retrieved 17 July 2016.
- ^ "SMHI climate data 2002-2015". SMHI. June 22, 2016. Archived from the original on May 2, 2019. Retrieved July 17, 2016.
- ^ "SMHI precipitation average 1961-1990". Swedish Metereological and Hydrological Institute (Lycksele code 14 833). Archived from the original on 2018-05-02. Retrieved 2016-07-17.
- ^ "SMHI climate data 2002-2015". SMHI. June 22, 2016. Archived from the original on May 2, 2019. Retrieved July 17, 2016.