Federal electoral district in British Columbia, Canada
Vancouver South (French : Vancouver-Sud electoral district in British Columbia , Canada, that has been represented in the House of Commons of Canada from 1917 to 1997, and since 2004. It covers the southern portion of the city of Vancouver , British Columbia.
Demographics [ edit ] The riding is one of the most diverse in Canada, with less than one-fifth of the population being of European descent.[2] [3] pan-ethnic groups form greater than 10 percent of the riding; 38.1% East Asian, 18.7% European, 17.8% South Asian and 16% Southeast Asian.
Vancouver South is the centre of the city's South Asian community ; the colourful Punjabi Market (Little India [4] [5]
Panethnic groups in Vancouver South (2001−2021) Panethnic 2021[6] 2016[7] 2011[8] 2006[9] 2001[10] Pop. % Pop. % Pop. % Pop. % Pop. % East Asian [a] 41,190 41,115 40,960 54,545 49,735 European [b] 20,175 19,180 19,180 28,240 31,435 South Asian 19,260 17,655 18,070 17,990 15,825 Southeast Asian [c] 17,275 15,360 13,815 11,295 9,305 Latin American 2,520 1,950 2,025 1,855 1,370 Indigenous 1,520 1,355 1,435 1,070 870 African 1,350 1,070 980 1,060 890 Middle Eastern [d] 1,075 840 715 1,180 815 Other[e] 3,615 2,745 1,835 1,655 1,095 Total responses 107,985 101,265 99,010 118,905 111,355 Total population 109,339 102,927 100,966 120,295 113,065 Notes: Totals greater than 100% due to multiple origin responses.2012 Canadian federal electoral redistribution .
^ Statistic includes total responses of "Chinese", "Korean", and "Japanese" under visible minority section on census. ^ Statistic includes all persons that did not make up part of a visible minority or an indigenous identity. ^ Statistic includes total responses of "Filipino" and "Southeast Asian" under visible minority section on census. ^ Statistic includes total responses of "West Asian" and "Arab" under visible minority section on census. ^ Statistic includes total responses of "Visible minority, n.i.e." and "Multiple visible minorities" under visible minority section on census.
History [ edit ] This electoral district was formed in 1914 from Vancouver City riding .
In 1996, it was abolished and used to create Vancouver South—Burnaby with portions of New Westminster—Burnaby .
Vancouver South was re-created in 2003 when the Burnaby sections were moved into the new ridings Burnaby—Douglas and Burnaby—New Westminster .
The 2012 federal electoral boundaries redistribution concluded that the electoral boundaries of Vancouver South should be adjusted, and a modified electoral district of the same name will be contested in future elections.[11] Cambie Street to the new district of Vancouver Granville , and gains a small area in the northeast currently included in Vancouver Kingsway . These new boundaries were legally defined in the 2013 representation order, which came into effect upon the call of the 42nd Canadian federal election , scheduled for October 2015.[12]
Historical boundaries [ edit ] 1914 representation order
1933 representation order
1947 representation order
1952 representation order
1966 representation order
1976 representation order
1987 representation order
1996 representation order (as Vancouver South—Burnaby)
2003 representation order
2013 representation order
2023 representation order (as Vancouver Fraserview—South Burnaby)
Members of Parliament [ edit ] This riding has elected the following members of Parliament :
Election results [ edit ] Vancouver South, 2004–present [ edit ] Its current representing MP is Harjit Sajjan , who is Minister of International Development in the current federal Cabinet. He has been its MP since the 2015 federal election, when he beat the Conservative then-incumbent by more than 6,000 votes.
Graph of election results in Vancouver South (since 2004, minor parties that never got 2% of the vote or didn't run consistently are omitted)
2021 Canadian federal election Party Candidate Votes % Expenditures Liberal Harjit Sajjan 19,910 49.4 $82,846.68 New Democratic Sean McQuillan 9,922 24.6 $3,175.98 Conservative Sukhbir Singh Gill 9,060 22.5 $90,407.62 People's Anthony Cook 1,104 2.7 $1,151.17 Marxist–Leninist Anne Jamieson 287 0.7 $0.00 Total valid votes/expense limit 40,283 100.0 – $108,408.40 Total rejected ballots 493 Turnout 40,776 Eligible voters Source: Elections Canada [13]
2019 Canadian federal election Party Candidate Votes % Expenditures Liberal Harjit Sajjan 17,808 41.2 -7.61 $96,879.65 Conservative Wai Young 14,388 33.3 -0.58 $82,900.36 New Democratic Sean McQuillan 8,015 18.6 +4.63 none listed Green Judy Zaichkowsky 2,451 5.7 +3.12 none listed People's Alain Deng 532 1.2 – $11,771.39 Total valid votes/expense limit 43,194 100.0 Total rejected ballots 431 Turnout 43,625 58.9 Eligible voters 74,114 Liberal hold Swing -3.52 Source: Elections Canada [14] [15]
2015 Canadian federal election : Vancouver South Party Candidate Votes % Expenditures Liberal Harjit Sajjan 21,773 48.81 +15.05 $161,402.16 Conservative Wai Young 15,115 33.88 -8.54 $118,748.27 New Democratic Amandeep Nijjar 6,230 13.97 -7.10 $63,954.79 Green Elain Ng 1,149 2.58 +0.37 $5,232.68 Marxist–Leninist Charles Boylan 178 0.40 -0.09 – Progressive Canadian Raj Gupta 166 0.37 – – Total valid votes/Expense limit 44,611 100.00 $203,440.39 Total rejected ballots 259 0.58 – Turnout 44,870 64.04 – Eligible voters 70,062 Liberal gain from Conservative Swing +11.80 Source: Elections Canada [16] [17]
2008 Canadian federal election Party Candidate Votes % Expenditures Liberal Ujjal Dosanjh 16,110 38.49 -9.56 $74,163 Conservative Wai Young 16,090 38.44 +11.30 $80,086 New Democratic Ann Chambers 7,376 17.62 -3.45 $22,765 Green Csaba Gulyas 2,065 4.93 +1.65 $413 Marxist–Leninist Charles Boylan 211 0.50 +0.04 Total valid votes/Expense limit 41,852 100.0 $85,093 Total rejected ballots 223 0.53 +0.12 Turnout 42,075 52.00 -4.00 Liberal hold Swing -10.43
2006 Canadian federal election Party Candidate Votes % Expenditures Liberal Ujjal Dosanjh 20,991 48.05 +3.54 $62,784 Conservative Tarlok Sablok 11,856 27.14 +1.64 $68,523 New Democratic Bev Meslo 9,205 21.07 -3.48 $30,481 Green Doug Perry 1,435 3.28 -0.30 $1,280 Marxist–Leninist Charles Boylan 202 0.46 +0.17 Total valid votes 43,689 100.0 Total rejected ballots 181 0.41 -0.29 Turnout 43,870 56.00 Liberal hold Swing +0.95
2004 Canadian federal election Party Candidate Votes % Expenditures Liberal Ujjal Dosanjh 18,196 44.51 $67,157 Conservative Victor Soo Chan 10,426 25.50 $70,471 New Democratic Bev Meslo 10,038 24.55 $33,575 Green Doug Perry 1,465 3.58 $1,451 Christian Heritage Frank Wagner 339 0.82 Marxist–Leninist Charles Boylan 119 0.29 $150 Communist Stephen Von Sychowski 105 0.25 $389 Independent H. Sandhu 98 0.23 $5,846 Canadian Action Joe Sixpack Horrocks 90 0.22 Total valid votes 40,876 100.0 Total rejected ballots 284 0.69 Turnout 41,160 56 This riding was re-created from parts of Vancouver South—Burnaby , which elected a Liberal in the previous election.
Vancouver South, 1917–1997 [ edit ] Graph of election results in Vancouver South (1917-1993, minor parties that never got 2% of the vote or didn't run consistently are omitted)
See also [ edit ] References [ edit ] ^ a b "Population and dwelling counts: Canada and federal electoral districts (2013 Representation Order)" . Statistics Canada . Government of Canada. February 9, 2022. Retrieved February 9, 2022 .^ The growing diversity within federal ridings . Policy Options. Retrieved on 2018-19-10.^ "Economy trumps all in culturally diverse Vancouver South" . The Globe And Mail. March 30, 2011.^ Conservative Wai Young beats Dosanjh in rematch . The Globe and Mail. Retrieved on 2014-04-12.^ Vancouver South , CBC.ca, 2008.^ Government of Canada, Statistics Canada (October 26, 2022). "Census Profile, 2021 Census of Population Vancouver South British Columbia [Federal electoral district (2013 Representation Order)" . www12.statcan.gc.ca . Retrieved November 17, 2022 . ^ Government of Canada, Statistics Canada (October 27, 2021). "Census Profile, 2016 Census Vancouver South [Federal electoral district], British Columbia and British Columbia [Province]" . www12.statcan.gc.ca . Retrieved November 17, 2022 . ^ Government of Canada, Statistics Canada (November 27, 2015). "NHS Profile, Vancouver South, British Columbia, 2011" . www12.statcan.gc.ca . Retrieved February 17, 2023 . ^ Government of Canada, Statistics Canada (August 20, 2019). "Federal Electoral District Profile of Vancouver South, British Columbia (2003 Representation Order), 2006 Census" . www12.statcan.gc.ca . Retrieved November 17, 2022 . ^ Government of Canada, Statistics Canada (July 2, 2019). "2Federal Electoral District Profile of Vancouver South - Vancouver-Sud, British Columbia (2003 Representation Order), 2001 Census" . www12.statcan.gc.ca . Retrieved November 6, 2022 . ^ Final Report – British Columbia ^ Timeline for the Redistribution of Federal Electoral Districts ^ "Confirmed candidates — Vancouver South" . Elections Canada . September 1, 2021. Retrieved September 6, 2021 .^ "List of confirmed candidates" . Elections Canada . Retrieved October 4, 2019 .^ "Election Night Results" . Elections Canada. Retrieved November 15, 2019 .^ Elections Canada – Confirmed candidates for Vancouver South, 30 September 2015 ^ Elections Canada – Preliminary Election Expenses Limits for Candidates ^ Pundits' Guide to Canadian Elections External links [ edit ]
49°13′N 123°04′W / 49.22°N 123.07°W / 49.22; -123.07
 From Wikipedia the free encyclopedia
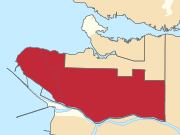 1914 representation order
 1933 representation order
 1947 representation order
 1952 representation order
 1966 representation order
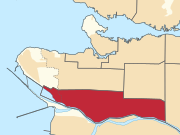 1976 representation order
 1987 representation order
 1996 representation order (as Vancouver South—Burnaby)
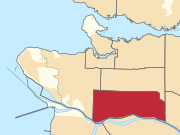 2003 representation order
 2013 representation order
 2023 representation order (as Vancouver Fraserview—South Burnaby)


.svg)


