Part of the 2009 Irish local elections
2009 South Tipperary County Council election|
|
|
| |
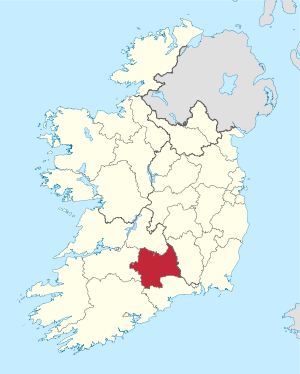 Map showing the area of South Tipperary County Council |
| | Council control after election
TBD
| |
An election to South Tipperary County Council took place on 5 June 2009 as part of that year's Irish local elections. 26 councillors were elected from five local electoral areas (LEAs) for a five-year term of office on the electoral system of proportional representation by means of the single transferable vote (PR-STV).[1]
Results by local electoral area
[edit] Cahir – 4 seats | Party | Candidate | FPv% | Count |
| 1 | 2 | 3 | 4 | 5 |
| | Labour | Seanie Lonergan* | 16.96 | 1,139 | 1,188 | 1,213 | 1,346 | |
| | Fianna Fáil | Michael Anglim* | 16.72 | 1,123 | 1,137 | 1,219 | 1,274 | 1,342 |
| | Fine Gael | Liam Ahearn* | 15.01 | 1,008 | 1,016 | 1,037 | 1,104 | 1,376 |
| | Fine Gael | Marie Murphy | 14.59 | 980 | 991 | 1,038 | 1,105 | 1,292 |
| | Fianna Fáil | Andy Moloney* | 12.63 | 848 | 858 | 981 | 1,065 | 1,139 |
| | Fine Gael | John G. O'Donnell | 8.68 | 583 | 593 | 617 | 699 | |
| | Independent | Dan Costigan | 7.27 | 488 | 536 | 563 | | |
| | Fianna Fáil | Tommy Meehan | 5.38 | 361 | 370 | | | |
| | Sinn Féin | Kevin Brunnick | 2.76 | 185 | | | | |
| Electorate: 10,033 Valid: 6,715 (66.93%) Spoilt: 84 Quota: 1,344 Turnout: 6,799 (67.77%) |
Cashel – 4 seats | Party | Candidate | FPv% | Count |
| 1 | 2 | 3 | 4 | 5 |
| | Fine Gael | Jack Crowe* | 19.25 | 1,264 | 1,347 | | | |
| | Independent | Tom Wood* | 17.99 | 1,181 | 1,332 | | | |
| | Fianna Fáil | Dr.Seán McCarthy* | 17.54 | 1,152 | 1,196 | 1,364 | | |
| | Fianna Fáil | Roger Kennedy* | 13.94 | 915 | 978 | 1,124 | 1,156 | 1,167 |
| | Fine Gael | Catherine McLoughlin | 13.86 | 910 | 1,005 | 1,159 | 1,177 | 1,199 |
| | Independent | Liam Browne | 9.18 | 603 | 680 | | | |
| | Labour | Patrick Downey | 8.24 | 541 | | | | |
| Electorate: 10,481 Valid: 6,566 (62.65%) Spoilt: 88 Quota: 1,314 Turnout: 6,654 (63.49%) |
Clonmel – 7 seats | Party | Candidate | FPv% | Count |
| 1 | 2 | 3 | 4 | 5 | 6 | 7 | 8 | 9 | 10 | 11 |
| | Workers and Unemployed | Seamus Healy* | 21.78 | 2,336 | | | | | | | | | | |
| | Fianna Fáil | Siobhán Ambrose | 10.82 | 1,160 | 1,214 | 1,292 | 1,331 | 1,368 | | | | | | |
| | Fine Gael | Tom Acheson | 8.23 | 883 | 905 | 922 | 944 | 992 | 1,054 | 1,175 | 1,179 | 1,510 | | |
| | Labour | Darren Ryan* | 7.87 | 844 | 928 | 986 | 1,142 | 1,216 | 1,240 | 1,319 | 1,324 | 1,421 | | |
| | Fine Gael | Michael Murphy | 7.80 | 837 | 876 | 889 | 915 | 958 | 989 | 1,065 | 1,067 | 1,355 | | |
| | Fine Gael | Derry Foley* | 6.61 | 709 | 726 | 739 | 762 | 804 | 844 | 971 | 974 | | | |
| | Workers and Unemployed | Pat English | 6.28 | 674 | 954 | 979 | 1,021 | 1,063 | 1,091 | 1,135 | 1,136 | 1,170 | 1,192 | 1,203 |
| | Fianna Fáil | Richie Molloy | 5.53 | 593 | 663 | 725 | 750 | 798 | 991 | 1,038 | 1,048 | 1,120 | 1,189 | 1,202 |
| | Workers and Unemployed | Billy Shoer* | 5.41 | 580 | 868 | 893 | 930 | 978 | 995 | 1,033 | 1,035 | 1,083 | 1,125 | 1,144 |
| | Fianna Fáil | Mark Davern | 4.53 | 486 | 500 | 515 | 520 | 528 | | | | | | |
| | Fine Gael | Denis Dunne | 4.45 | 477 | 504 | 516 | 531 | 569 | 603 | | | | | |
| | Green | Bernard Lennon | 3.81 | 409 | 451 | 465 | 492 | | | | | | | |
| | Labour | Gabrielle Egan | 3.68 | 395 | 432 | 449 | | | | | | | | |
| | Fianna Fáil | Martin O'Brien | 3.19 | 342 | 363 | | | | | | | | | |
| Electorate: 16,776 Valid: 10,725 (63.93%) Spoilt: 135 Quota: 1,341 Turnout: 10,860 (64.74%) |
Fethard – 6 seats | Party | Candidate | FPv% | Count |
| 1 | 2 | 3 | 4 | 5 | 6 | 7 | 8 | 9 | 10 | 11 |
| | Fine Gael | Jimmy O'Brien | 23.92 | 2,438 | | | | | | | | | | |
| | Fine Gael | Joe Brennan | 11.08 | 1,130 | 1,287 | 1,306 | 1,347 | 1,418 | 1,441 | 1,454 | 1,552 | | | |
| | Fine Gael | John Fahey* | 9.32 | 950 | 1,255 | 1,259 | 1,265 | 1,272 | 1,377 | 1,449 | 1,452 | 1,453 | 1,612 | |
| | Labour | Denis Landy* | 8.97 | 914 | 943 | 959 | 1,001 | 1,065 | 1,173 | 1,181 | 1,266 | 1,280 | 1,297 | 1,507 |
| | Independent | Eddie O'Meara* | 8.40 | 856 | 1,006 | 1,016 | 1,021 | 1,041 | 1,066 | 1,136 | 1,147 | 1,152 | 1,210 | 1,257 |
| | Fianna Fáil | Pat O'Meara | 6.08 | 620 | 675 | 675 | 675 | 676 | 700 | 826 | 842 | 843 | 964 | 978 |
| | Fianna Fáil | Sylvia Cooney-Sheehan | 5.91 | 602 | 615 | 622 | 682 | 755 | 760 | 802 | 1,011 | 1,051 | 1,106 | 1,230 |
| | Sinn Féin | David Dunne | 5.11 | 521 | 531 | 539 | 559 | 593 | 621 | 627 | 664 | 678 | 690 | |
| | Fianna Fáil | Kieran Bourke* | 4.32 | 440 | 443 | 448 | 475 | 508 | 509 | 523 | | | | |
| | Fianna Fáil | Benny Tynan | 3.62 | 369 | 473 | 477 | 477 | 479 | 500 | 556 | 566 | 567 | | |
| | Fianna Fáil | Michael Cooney | 3.58 | 365 | 433 | 435 | 436 | 440 | 467 | | | | | |
| | Labour | Michael Cleere | 3.38 | 345 | 410 | 410 | 411 | 414 | | | | | | |
| | Independent | Pierce O'Loughlin | 2.83 | 288 | 293 | 307 | 353 | | | | | | | |
| | Independent | Noel Brophy | 2.30 | 234 | 238 | 264 | | | | | | | | |
| | Independent | Colin Simpson | 1.20 | 122 | 135 | | | | | | | | | |
| Electorate: 14,896 Valid: 10,194 (68.43%) Spoilt: 179 Quota: 1,457 Turnout: 10,373 (69.64%) |
Tipperary – 5 seats | Party | Candidate | FPv% | Count |
| 1 | 2 | 3 | 4 | 5 | 6 | 7 | 8 | 9 | 10 | 11 |
| | Fine Gael | Michael Fitzgerald* | 22.35 | 2,034 | | | | | | | | | | |
| | Fine Gael | John Crosse* | 12.85 | 1,169 | 1,270 | 1,325 | 1,408 | 1,435 | 1,502 | 1,512 | 1,565 | | | |
| | Fine Gael | Mary Hourigan | 12.48 | 1,136 | 1,269 | 1,319 | 1,392 | 1,416 | 1,536 | | | | | |
| | Fianna Fáil | Joe Donovan* | 8.91 | 811 | 901 | 909 | 921 | 938 | 1,011 | 1,014 | 1,040 | 1,133 | 1,134 | 1,250 |
| | Fianna Fáil | Michael Maguire* | 8.13 | 740 | 779 | 788 | 810 | 816 | 878 | 882 | 915 | 1,070 | 1,074 | 1,248 |
| | Independent | Denis Leahy | 6.87 | 625 | 655 | 667 | 680 | 708 | 712 | 712 | 874 | 978 | 990 | 1,292 |
| | Labour | Mick Byrnes | 6.80 | 619 | 645 | 663 | 699 | 805 | 814 | 815 | 878 | 937 | 950 | |
| | Fianna Fáil | Dr. John Wallace | 5.13 | 467 | 483 | 491 | 498 | 518 | 531 | 532 | 585 | | | |
| | Independent | Christy Kinahan* | 4.39 | 399 | 422 | 439 | 447 | 486 | 490 | 490 | | | | |
| | Fianna Fáil | Patrick Fahey | 3.71 | 338 | 345 | 365 | 370 | 370 | | | | | | |
| | Labour | Billy Bourke | 2.92 | 266 | 277 | 297 | 306 | | | | | | | |
| | Independent | Paul Barry | 2.77 | 252 | 259 | | | | | | | | | |
| | Fine Gael | David Byrnes | 2.67 | 243 | 277 | 283 | | | | | | | | |
| Electorate: 13,729 Valid: 9,099 (66.28%) Spoilt: 150 Quota: 1,517 Turnout: 9,249 (67.37%) |
 From Wikipedia the free encyclopedia