Saint Mary Parish (Antigua and Barbuda)
| Demographics of Saint Mary Parish |
|---|
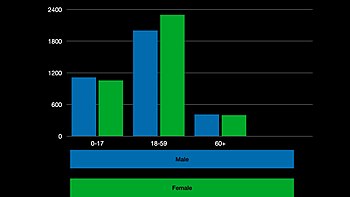 This image displays a graph of the age groups of Saint Mary Parish, Antigua and Barbuda |
| Population |  7,341 7,341 |
|---|
| Density | 124.24 people per.sq.km (2011 est.) |
|---|
|
| Major ethnic | Afro-Antiguans and Barbudans (92.13%)[1] |
|---|
| Minor ethnic | White Antiguans and Barbudans (3.49%)[1] |
|---|
|
| Official | English |
|---|
Demographic features of the population of Saint Mary's include population density, internet access, crime rate, and other aspects of the population.
Population[edit]
According to the 2011 census the population of Saint Mary was 7,341.[2]
Other demographics statistics (2011)[edit]
Census Data (2011)[edit]
Source:[3]
Individual[edit]
| Q48 Ethnic | Counts | % |
| African descendent | 6,754 | 92.13% |
| Caucasian/White | 256 | 3.49% |
| East Indian/India | 27 | 0.37% |
| Mixed (Black/White) | 35 | 0.48% |
| Mixed (Other) | 118 | 1.61% |
| Hispanic | 55 | 0.75% |
| Syrian/Lebanese | 3 | 0.04% |
| Other | 36 | 0.49% |
| Don't know/Not stated | 46 | 0.63% |
| Total | 7,331 | 100.00% |
| Q49 Religion | Counts | % |
| Adventist | 1,259 | 17.20% |
| Anglican | 1,606 | 21.94% |
| Baptist | 144 | 1.96% |
| Church of God | 211 | 2.89% |
| Evangelical | 156 | 2.14% |
| Jehovah Witness | 41 | 0.56% |
| Methodist | 348 | 4.76% |
| Moravian | 1,113 | 15.21% |
| Nazarene | 173 | 2.37% |
| None/no religion | 478 | 6.54% |
| Pentecostal | 571 | 7.81% |
| Rastafarian | 100 | 1.37% |
| Roman Catholic | 343 | 4.69% |
| Weslyan Holiness | 351 | 4.79% |
| Other | 181 | 2.47% |
| Don't know/Not stated | 243 | 3.32% |
| Total | 7,319 | 100.00% |
| NotApp : | 12 | |
| Q55 Internet Use | Counts | % |
| Yes | 3,059 | 41.73% |
| No | 4,116 | 56.15% |
| Don't know/Not stated | 155 | 2.12% |
| Total | 7,331 | 100.00% |
| Q58. Country of birth | Counts | % |
| Africa | 21 | 0.29% |
| Other Latin or North American countries | 7 | 0.10% |
| Antigua and Barbuda | 5,609 | 76.51% |
| Other Caribbean countries | 29 | 0.39% |
| Canada | 51 | 0.69% |
| Other Asian countries | 19 | 0.26% |
| Other European countries | 70 | 0.95% |
| Dominica | 218 | 2.97% |
| Dominican Republic | 46 | 0.63% |
| Guyana | 338 | 4.61% |
| Jamaica | 323 | 4.41% |
| Monsterrat | 35 | 0.48% |
| St. Kitts and Nevis | 27 | 0.37% |
| St. Lucia | 22 | 0.30% |
| St. Vincent and the Grenadines | 21 | 0.29% |
| Trinidad and Tobago | 30 | 0.40% |
| United Kingdom | 119 | 1.63% |
| USA | 230 | 3.14% |
| USVI United States Virgin Islands | 53 | 0.72% |
| Not Stated | 63 | 0.86% |
| Total | 7,331 | 100.00% |
| Q71 Country of Citizenship 1 | Counts | % |
| Antigua and Barbuda | 6,225 | 84.92% |
| Other Caribbean countries | 24 | 0.33% |
| Canada | 40 | 0.55% |
| Other Asian and Middle Eastern countries | 13 | 0.17% |
| Dominica | 126 | 1.71% |
| Dominican Republic | 25 | 0.35% |
| Guyana | 256 | 3.49% |
| Jamaica | 260 | 3.54% |
| Monsterrat | 22 | 0.30% |
| St. Lucia | 10 | 0.13% |
| St. Vincent and the Grenadines | 14 | 0.19% |
| Trinidad and Tobago | 13 | 0.17% |
| United Kingdom | 76 | 1.04% |
| USA | 117 | 1.60% |
| Other countries | 62 | 0.85% |
| Not Stated | 49 | 0.66% |
| Total | 7,331 | 100.00% |
| Q71 Country of Citizenship 2 (Country of Second Citizenship) | Counts | % |
| Other Caribbean countries | 71 | 8.49% |
| Canada | 40 | 4.82% |
| Other Asian and Middle Eastern countries | 3 | 0.38% |
| Dominica | 86 | 10.27% |
| Dominican Republic | 19 | 2.28% |
| Guyana | 82 | 9.89% |
| Jamaica | 69 | 8.24% |
| Monsterrat | 17 | 2.03% |
| St. Lucia | 14 | 1.65% |
| St. Vincent and the Grenadines | 13 | 1.52% |
| Trinidad and Tobago | 16 | 1.90% |
| United Kingdom | 97 | 11.66% |
| USA | 258 | 30.93% |
| Other countries | 50 | 5.96% |
| Total | 833 | 100.00% |
| NotApp : | 6,498 | |
| Q77 Training | Counts | % |
| Yes | 1,731 | 31.23% |
| No | 3,568 | 64.39% |
| Don't know/Not stated | 243 | 4.38% |
| Total | 5,542 | 100.00% |
| NotApp : | 1,789 | |
| Employment status | Counts | % |
| Employed | 3,391 | 61.19% |
| Unemployed | 341 | 6.15% |
| Inactive | 1,773 | 31.99% |
| Not stated | 37 | 0.67% |
| Total | 5,542 | 100.00% |
| NotApp : | 1,789 | |
| Q47 Age | Counts | % |
| 0 | 124 | 1.69% |
| 1 | 127 | 1.73% |
| 2 | 108 | 1.47% |
| 3 | 109 | 1.48% |
| 4 | 139 | 1.90% |
| 5 | 124 | 1.69% |
| 6 | 99 | 1.35% |
| 7 | 102 | 1.40% |
| 8 | 124 | 1.69% |
| 9 | 116 | 1.58% |
| 10 | 137 | 1.87% |
| 11 | 124 | 1.69% |
| 12 | 108 | 1.47% |
| 13 | 134 | 1.83% |
| 14 | 115 | 1.57% |
| 15 | 134 | 1.83% |
| 16 | 108 | 1.47% |
| 17 | 143 | 1.94% |
| 18 | 112 | 1.53% |
| 19 | 135 | 1.84% |
| 20 | 111 | 1.51% |
| 21 | 110 | 1.50% |
| 22 | 113 | 1.54% |
| 23 | 121 | 1.66% |
| 24 | 99 | 1.35% |
| 25 | 110 | 1.50% |
| 26 | 105 | 1.43% |
| 27 | 98 | 1.34% |
| 28 | 97 | 1.33% |
| 29 | 100 | 1.37% |
| 30 | 113 | 1.54% |
| 31 | 130 | 1.77% |
| 32 | 111 | 1.51% |
| 33 | 93 | 1.27% |
| 34 | 115 | 1.57% |
| 35 | 108 | 1.47% |
| 36 | 115 | 1.57% |
| 37 | 92 | 1.25% |
| 38 | 116 | 1.58% |
| 39 | 125 | 1.70% |
| 40 | 111 | 1.51% |
| 41 | 99 | 1.35% |
| 42 | 102 | 1.40% |
| 43 | 124 | 1.69% |
| 44 | 92 | 1.25% |
| 45 | 98 | 1.34% |
| 46 | 125 | 1.70% |
| 47 | 113 | 1.54% |
| 48 | 100 | 1.37% |
| 49 | 102 | 1.40% |
| 50 | 99 | 1.35% |
| 51 | 110 | 1.50% |
| 52 | 77 | 1.05% |
| 53 | 77 | 1.05% |
| 54 | 94 | 1.28% |
| 55 | 81 | 1.11% |
| 56 | 74 | 1.01% |
| 57 | 77 | 1.05% |
| 58 | 64 | 0.88% |
| 59 | 55 | 0.75% |
| 60 | 64 | 0.88% |
| 61 | 63 | 0.86% |
| 62 | 44 | 0.61% |
| 63 | 50 | 0.68% |
| 64 | 32 | 0.43% |
| 65 | 43 | 0.59% |
| 66 | 42 | 0.58% |
| 67 | 35 | 0.48% |
| 68 | 38 | 0.52% |
| 69 | 38 | 0.52% |
| 70 | 38 | 0.52% |
| 71 | 24 | 0.33% |
| 72 | 34 | 0.46% |
| 73 | 14 | 0.19% |
| 74 | 30 | 0.40% |
| 75-79 | 96 | 1.31% |
| 80-84 | 91 | 1.24% |
| 85-89 | 50 | 0.68% |
| 90 and over | 27 | 0.37% |
| Total | 7,331 | 100.00% |
Household[edit]
There are 2,512 households in Saint Mary Parish.
| Q4 Year built | Counts | % |
| Before 1980 | 283 | 11.27% |
| 1980 - 1989 | 338 | 13.46% |
| 1990 - 1999 | 549 | 21.86% |
| 2000 - 2006 | 366 | 14.57% |
| Year 2007 | 51 | 2.03% |
| Year 2008 | 41 | 1.63% |
| Year 2009 | 45 | 1.79% |
| Year 2010 | 58 | 2.31% |
| Don't Know/not stated | 781 | 31.09% |
| Total | 2,512 | 100.00% |
| Q9 Insurance (Contents) | Counts | % |
| Yes | 248 | 9.87% |
| Yes, partially | 65 | 2.59% |
| No | 1,781 | 70.90% |
| Don't know/ Not stated | 418 | 16.64% |
| Total | 2,512 | 100.00% |
| Q23 1 Air conditioner | Counts | % |
| Yes | 268 | 10.67% |
| No | 2,243 | 89.29% |
| Not Stated | 1 | 0.04% |
| Total | 2,512 | 100.00% |
| Q23 3b Laptop Computer | Counts | % |
| Yes | 749 | 29.82% |
| No | 1,762 | 70.14% |
| Not Stated | 1 | 0.04% |
| Total | 2,512 | 100.00% |
| Q23 3a Desktop Computer | Counts | % |
| Yes | 589 | 23.45% |
| No | 1,922 | 76.51% |
| Not Stated | 1 | 0.04% |
| Total | 2,512 | 100.00% |
| Q11 Garbage disposal | Counts | % |
| Garbage truck Private | 115 | 4.58% |
| Garbage truck Public | 2,335 | 92.95% |
| Other (inc. burning, burying, compost, dumping) | 32 | 1.27% |
| Don't know/Not stated | 30 | 1.19% |
| Total | 2,512 | 100.00% |
| Q23 9 Mobile | Counts | % |
| Yes | 2,140 | 85.19% |
| No | 371 | 14.77% |
| Not Stated | 1 | 0.04% |
| Total | 2,512 | 100.00% |
| Q23 10 Radio | Counts | % |
| Yes | 1,719 | 68.43% |
| No | 792 | 31.53% |
| Not Stated | 1 | 0.04% |
| Total | 2,512 | 100.00% |
| Q24 Motor Vehicles | Counts | % |
| 0 | 1,105 | 47.30% |
| 1 | 854 | 36.56% |
| 2 | 282 | 12.07% |
| 3 | 56 | 2.40% |
| 4 or more | 39 | 1.67% |
| Total | 2,336 | 100.00% |
| Missing : | 176 | |
| Q25 4 Internet access | Counts | % |
| No | 1,431 | 56.97% |
| Yes | 705 | 28.07% |
| Don't know/not declared | 376 | 14.97% |
| Total | 2,512 | 100.00% |
See also[edit]
Demographics of Antigua and Barbuda
References[edit]
 From Wikipedia the free encyclopedia