Results of the 2010 Australian federal election in territories
 From Wikipedia the free encyclopedia
2010 Australian federal election |
|---|
| National results |
| State and territory results |
| |
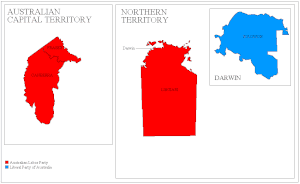
This is a list of electoral divisions for the Australian 2010 federal election for the Australian Capital Territory[1] and the Northern Territory.[2]
Australian Capital Territory
[edit]
| |||||||||||||||||||||||||||||||||||||
Both Australian Capital Territory seats in the Australian House of Representatives and both seats in the Australian Senate | |||||||||||||||||||||||||||||||||||||
|---|---|---|---|---|---|---|---|---|---|---|---|---|---|---|---|---|---|---|---|---|---|---|---|---|---|---|---|---|---|---|---|---|---|---|---|---|---|
| |||||||||||||||||||||||||||||||||||||
 Electoral divisions: Territories | |||||||||||||||||||||||||||||||||||||
| Party | Votes | % | Swing | Seats | Change | |
|---|---|---|---|---|---|---|
| Australian Labor Party | 100,700 | 45.02 | –6.08 | 2 | ||
| Liberal | 77,880 | 34.81 | +1.58 | 0 | ||
| Australian Greens | 42,942 | 19.20 | +6.04 | |||
| Secular Party of Australia | 2,175 | 0.97 | +0.97 | |||
| Total | 223,697 | 2 | ||||
| Two-party-preferred vote | ||||||
| Australian Labor Party | 137,948 | 61.67 | –1.73 | 2 | ||
| Liberal | 85,749 | 38.33 | +1.73 | 0 | ||
| Invalid/blank votes | 10,926 | 4.66 | +2.35 | |||
| Registered voters/turnout | 247,941 | 94.63 | ||||
| Source: Commonwealth Election 2010 | ||||||
Results by division
[edit]Canberra
[edit]| Party | Candidate | Votes | % | ±% | |
|---|---|---|---|---|---|
| Labor | Gai Brodtmann | 49,608 | 44.23 | −6.87 | |
| Liberal | Giulia Jones | 41,732 | 37.21 | +2.08 | |
| Greens | Sue Ellerman | 20,816 | 18.56 | +5.61 | |
| Total formal votes | 112,156 | 95.12 | −2.62 | ||
| Informal votes | 5,755 | 4.88 | +2.62 | ||
| Turnout | 117,911 | 94.92 | −1.09 | ||
| Two-party-preferred result | |||||
| Labor | Gai Brodtmann | 66,335 | 59.15 | −2.67 | |
| Liberal | Giulia Jones | 45,821 | 40.85 | +2.67 | |
| Labor hold | Swing | −2.67 | |||
Fraser
[edit]| Party | Candidate | Votes | % | ±% | |
|---|---|---|---|---|---|
| Labor | Andrew Leigh | 51,092 | 45.81 | −5.29 | |
| Liberal | James Milligan | 36,148 | 32.41 | +1.18 | |
| Greens | Indra Esguerra | 22,126 | 19.84 | +6.46 | |
| Secular | Quintin Hedges-Phillips | 2,175 | 1.95 | +1.95 | |
| Total formal votes | 111,541 | 95.57 | −2.07 | ||
| Informal votes | 5,171 | 4.43 | +2.07 | ||
| Turnout | 116,712 | 94.55 | −1.12 | ||
| Two-party-preferred result | |||||
| Labor | Andrew Leigh | 71,613 | 64.20 | −0.87 | |
| Liberal | James Milligan | 39,928 | 35.80 | +0.87 | |
| Labor hold | Swing | −0.87 | |||
Northern Territory
[edit]
| |||||||||||||||||||||||||||||||||||||
Both Northern Territory seats in the Australian House of Representatives and both seats in the Australian Senate | |||||||||||||||||||||||||||||||||||||
|---|---|---|---|---|---|---|---|---|---|---|---|---|---|---|---|---|---|---|---|---|---|---|---|---|---|---|---|---|---|---|---|---|---|---|---|---|---|
| |||||||||||||||||||||||||||||||||||||
 Electoral divisions: Territories | |||||||||||||||||||||||||||||||||||||
| Party | Votes | % | Swing | Seats | Change | |
|---|---|---|---|---|---|---|
| Country Liberal Party | 38,335 | 40.83 | –0.20 | 1 | ||
| Australian Labor Party | 35,589 | 37.91 | –9.74 | 1 | ||
| Australian Greens | 12,175 | 12.97 | +4.92 | |||
| Independents | 3,948 | 4.21 | +1.55 | |||
| Citizens Electoral Council | 2,331 | 2.48 | +2.23 | |||
| One Nation | 1,505 | 1.60 | +1.60 | |||
| Total | 93,883 | 2 | ||||
| Two-party-preferred vote | ||||||
| Australian Labor Party | 47,636 | 50.74 | –4.67 | 1 | ||
| Country Liberal Party | 46,247 | 49.26 | +4.67 | 1 | ||
| Invalid/blank votes | 6,198 | 6.19 | +2.34 | |||
| Registered voters/turnout | 121,059 | 82.67 | ||||
| Source: Commonwealth Election 2010 | ||||||
Results by division
[edit]Lingiari
[edit]| Party | Candidate | Votes | % | ±% | |
|---|---|---|---|---|---|
| Labor | Warren Snowdon | 17,205 | 40.08 | −13.91 | |
| Country Liberal | Leo Abbott | 14,708 | 34.26 | −0.40 | |
| Greens | Barbara Shaw | 5,403 | 12.59 | +5.67 | |
| Independent | Deirdre Finter | 2,038 | 4.75 | +4.75 | |
| First Nations | Kenny Lechleitner | 1,910 | 4.45 | +4.45 | |
| Citizens Electoral Council | Peter Flynn | 1,663 | 3.87 | +3.87 | |
| Total formal votes | 42,927 | 92.50 | −2.65 | ||
| Informal votes | 3,482 | 7.50 | +2.65 | ||
| Turnout | 46,409 | 75.92 | −5.34 | ||
| Two-party-preferred result | |||||
| Labor | Warren Snowdon | 23,051 | 53.70 | −7.46 | |
| Country Liberal | Leo Abbott | 19,876 | 46.30 | +7.46 | |
| Labor hold | Swing | −7.46 | |||
Solomon
[edit]| Party | Candidate | Votes | % | ±% | |
|---|---|---|---|---|---|
| Country Liberal | Natasha Griggs | 23,627 | 46.37 | −0.43 | |
| Labor | Damian Hale | 18,384 | 36.08 | −5.82 | |
| Greens | Emma Young | 6,772 | 13.29 | +4.22 | |
| One Nation | John Kearney | 1,505 | 2.95 | +2.95 | |
| Citizens Electoral Council | Trudy Campbell | 668 | 1.31 | +0.83 | |
| Total formal votes | 50,956 | 94.94 | −2.13 | ||
| Informal votes | 2,716 | 5.06 | +2.13 | ||
| Turnout | 53,672 | 89.63 | −2.43 | ||
| Two-party-preferred result | |||||
| Country Liberal | Natasha Griggs | 26,371 | 51.75 | +1.94 | |
| Labor | Damian Hale | 24,585 | 48.25 | −1.94 | |
| Country Liberal gain from Labor | Swing | +1.94 | |||
See also
[edit]- 2010 Australian federal election
- Results of the 2010 Australian federal election (House of Representatives)
- Post-election pendulum for the 2010 Australian federal election
- Members of the Australian House of Representatives, 2010–2013
References
[edit]- ^ "2010 results for ACT". AEC.
- ^ "2010 results for NT". AEC.
- ^ "2010 results for Canberra". AEC.
- ^ "2010 results for Fraser". AEC.
- ^ "2010 results for Lingiari". AEC.
- ^ "2010 results for Solomon". AEC.


