ファイル:Pre-term corticosteroid data.svg


この SVG ファイルのこの PNG プレビューのサイズ: 684 × 309 ピクセル. その他の解像度: 320 × 145 ピクセル | 640 × 289 ピクセル | 1,024 × 463 ピクセル | 1,280 × 578 ピクセル | 2,560 × 1,156 ピクセル。
元のファイル (SVG ファイル、684 × 309 ピクセル、ファイルサイズ: 95キロバイト)
ウィキメディア・コモンズのファイルページにある説明を、以下に表示します。 |
概要
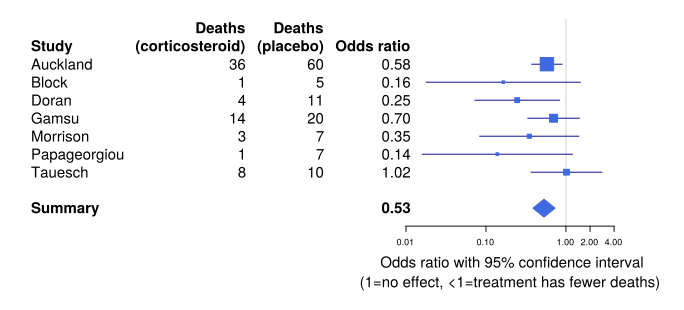
| 解説 | English: This forest plot shows trials of the use of corticosteroids to hasten lung development in pre-term babies. It is an iconic illustration of the power of medical reviews to save lives. The iconic review is from the 1980s, so this plot does not contain all the evidence of the up-to-date version of the same review. This data is the data from which the logo for Cochrane (organisation) is derived. |
| 日付 | |
| 原典 | Source code modified by User:HLHJ from the data and plotting scripts supplied with the GPL-2-licensed software package rmeta (part of the R statistical environment). See rmeta documentation. |
| 作者 | Thomas Lumley, User:HLHJ |
| SVG 開発 | |
| ソースコード | R codeinstall.packages("rmeta") library(rmeta) data(cochrane) svg("cochrane_logo_data.svg",width=9,height=4.35) steroid <- meta.MH(n.trt, n.ctrl, ev.trt, ev.ctrl, names=name, data=cochrane) tabletext<-cbind( c("","Study",steroid$names,NA,"Summary"), #Just tags, not single-author papers # c("","Year",c(1111,1111,1111,1111,1111,1111,1111),NA,NA), #Don't have this data c("Deaths","(corticosteroid)",cochrane$ev.trt,NA,NA), c("Deaths","(placebo)", cochrane$ev.ctrl, NA,NA), c("","Odds ratio",format(exp(steroid$logOR),digits=2),NA,format(exp(steroid$logMH),digits=2)) ) m<- c(NA,NA,steroid$logOR,NA,steroid$logMH) #Mean l<- m-c(NA,NA,steroid$selogOR,NA,steroid$selogMH)*2 #Lower u<- m+c(NA,NA,steroid$selogOR,NA,steroid$selogMH)*2 #Upper forestplot(tabletext,m,l,u,zero=0,is.summary=c(TRUE,TRUE,rep(FALSE,8),TRUE), clip=c(log(0.015),log(3)), xlog=TRUE, xticks=c(0.01,0.1,1,2,4), col=meta.colors(box="royalblue",line="darkblue", summary="royalblue")) forestplot(tabletext,m,l,u,zero=0,is.summary=c(TRUE,TRUE,rep(FALSE,8),TRUE), clip=c(log(0.015),log(3)), xlog=TRUE, #boxsize=0.75, xticks=c(0.01,0.1,1,2,4), xlab="\nOdds ratio with 95% confidence interval\n(1=no effect, <1=treatment has fewer deaths)", col=meta.colors(box="royalblue",line="darkblue", summary="royalblue")) dev.off() |
 | この作品は自由ソフトウェアです。あなたは、フリーソフトウェア財団の発行する GNU 一般公衆利用許諾書 (GNU General Public License) (バージョン2) の規約に基づき、この作品の再配布や改変ができます。この作品は、有用であることを期待して配布されていますが、商用あるいは特定の目的に適するかどうかも含めて、暗黙的にも、一切保証されません。詳しくは、バージョン2のGNU 一般公衆利用許諾書をご覧ください。 |
ファイルの履歴
過去の版のファイルを表示するには、その版の日時をクリックしてください。
| 日付と時刻 | サムネイル | 寸法 | 利用者 | コメント | |
|---|---|---|---|---|---|
| 現在の版 | 2017年10月21日 (土) 20:00 | | 684 × 309 (95キロバイト) | HLHJ | Took out background and cropped using Inkscape |
| 2017年10月21日 (土) 18:13 |  | 810 × 391 (63キロバイト) | HLHJ | User created page with UploadWizard |
ファイルの使用状況
以下の 2 ページがこのファイルを使用しています:
グローバルなファイル使用状況
以下に挙げる他のウィキがこの画像を使っています:
- en.wikipedia.org での使用状況
- fr.wikipedia.org での使用状況
- he.wikipedia.org での使用状況
- pl.wikipedia.org での使用状況
- zh.wikipedia.org での使用状況