ファイル:2017 US Tax Cuts and Jobs Act. Distribution of impact by income group.png
 ウィキペディアから無料の百科事典
元のファイル (1,280 × 720 ピクセル、ファイルサイズ: 264キロバイト、MIME タイプ: image/png)
ウィキメディア・コモンズのファイルページにある説明を、以下に表示します。 |
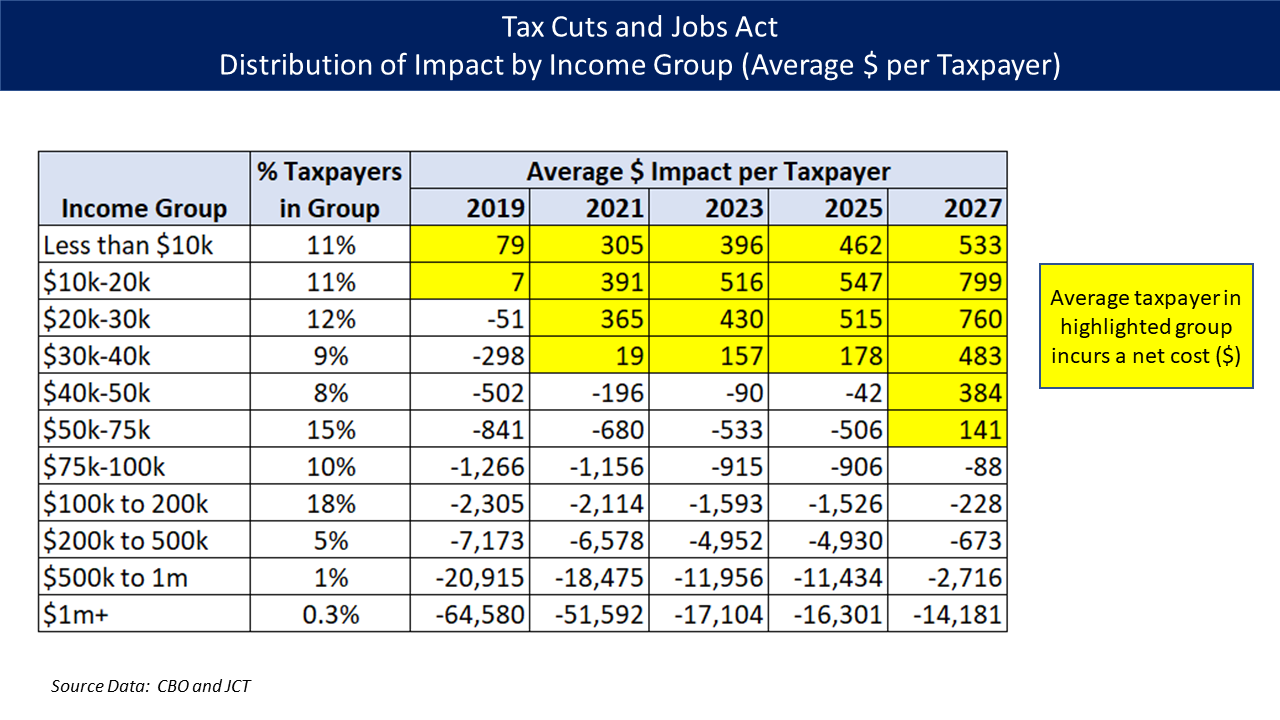
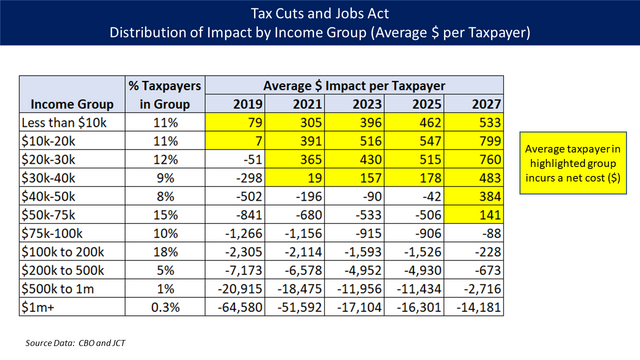
Understanding the chart
CBO and JCT estimate of the distribution of impact by income group (average dollars per taxpayer) under the Tax Cuts and Jobs Act. On average, taxpayers in the income groups highlighted in yellow will incur a net cost (shown as a positive figure as this reduces the budget deficit), mainly due to reduced healthcare subsidies. Higher income taxpayers receive a benefit via tax cuts (shown as a negative number as this increases the budget deficit). The percent of taxpayers in each income group is also shown for the 2023 period.
The CBO provided a total impact for each group as a whole in millions of dollars. The JCT provided the number of taxpayers in each group in thousands.[1] Dividing the CBO figure by the JCT figure and multiplying by 1,000 gives you the resulting dollar impact for the average taxpayer in the group, shown in each cell in the table.[2]
The term "taxpayer" in the chart refers to the more formal "tax filing unit" in the CBO and JCT studies. A tax filing unit is a tax return, meaning it could represent one person or a married couple filing jointly, among other options.
References
概要
| 解説 | English: Distribution of impact by income group (average dollars per taxpayer) under the Tax Cuts and Jobs Act |
| 日付 | |
| 原典 | 投稿者自身による著作物 |
| 作者 | Farcaster |
ライセンス
- あなたは以下の条件に従う場合に限り、自由に
- 共有 – 本作品を複製、頒布、展示、実演できます。
- 再構成 – 二次的著作物を作成できます。
- あなたの従うべき条件は以下の通りです。
- 表示 – あなたは適切なクレジットを表示し、ライセンスへのリンクを提供し、変更があったらその旨を示さなければなりません。これらは合理的であればどのような方法で行っても構いませんが、許諾者があなたやあなたの利用行為を支持していると示唆するような方法は除きます。
- 継承 – もしあなたがこの作品をリミックスしたり、改変したり、加工した場合には、あなたはあなたの貢献部分を元の作品とこれと同一または互換性があるライセンスの下に頒布しなければなりません。
ファイルの履歴
過去の版のファイルを表示するには、その版の日時をクリックしてください。
| 日付と時刻 | サムネイル | 寸法 | 利用者 | コメント | |
|---|---|---|---|---|---|
| 現在の版 | 2017年12月29日 (金) 05:06 | | 1,280 × 720 (264キロバイト) | Farcaster | User created page with UploadWizard |
ファイルの使用状況
以下のページがこのファイルを使用しています:
グローバルなファイル使用状況
以下に挙げる他のウィキがこの画像を使っています:
- en.wikipedia.org での使用状況