ファイル:OECD Tax revenue.svg
 ウィキペディアから無料の百科事典

この SVG ファイルのこの PNG プレビューのサイズ: 800 × 400 ピクセル. その他の解像度: 320 × 160 ピクセル | 640 × 320 ピクセル | 1,024 × 512 ピクセル | 1,280 × 640 ピクセル | 2,560 × 1,280 ピクセル | 1,440 × 720 ピクセル。
元のファイル (SVG ファイル、1,440 × 720 ピクセル、ファイルサイズ: 155キロバイト)
ウィキメディア・コモンズのファイルページにある説明を、以下に表示します。 |
 | このファイルは、最新の情報を受けて更新される可能性があります。 新しい更新が反映されることなく、特定の版のファイルを使用したい場合は、必要な版を別のファイルとしてアップロードしてください。 |
概要
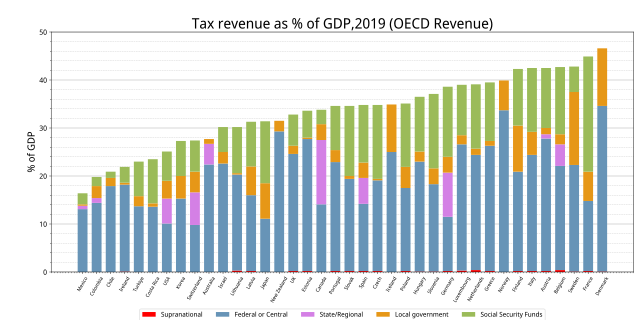
| 解説 | English: Tax revenue as percentage of GDP (OECD Revenue) |
| 日付 | |
| 原典 | https://stats.oecd.org/Index.aspx?DataSetCode=REV |
| 作者 | Yuasan |
| 許可 (ファイルの再利用) | CC-0 |
ライセンス
この作品の著作権者である私は、この作品を以下のライセンスで提供します。
| このファイルはクリエイティブ・コモンズ CC0 1.0 全世界 パブリック・ドメイン提供のもとで利用可能にされています。 | |
| ある作品に本コモンズ証を関連づけた者は、その作品について世界全地域において著作権法上認められる、その者が持つすべての権利(その作品に関する権利や隣接する権利を含む。)を、法令上認められる最大限の範囲で放棄して、パブリック・ドメインに提供しています。 この作品は、たとえ営利目的であっても、許可を得ずに複製、改変・翻案、配布、上演・演奏することが出来ます。 |
graph data
import matplotlib.pyplot as plt import pandas as pd df = pd.read_csv("data.tsv", index_col=0 , sep = "\t") df = df.fillna(0) df = df.sort_values(by=["Total"], ascending=True) fig, ax = plt.subplots(figsize=(16, 8)) ax.bar(df.index, df["Supranational"] , color="#FF0000", width=0.7) ax.bar(df.index, df["Federal or Central"], color="#6794B7", width=0.7, bottom=df["Supranational"] ) ax.bar(df.index, df["State/Regional"] , color="#D480E5", width=0.7, bottom=df["Supranational"] + df["Federal or Central"] ) ax.bar(df.index, df["Local government"], color="#E69717", width=0.7, bottom=df["Supranational"] + df["Federal or Central"] + df["State/Regional"] ) ax.bar(df.index, df["Social Security Funds"], color="#9BBB59", width=0.7, bottom=df["Supranational"] + df["Federal or Central"] + df["State/Regional"]+ df["Local government"] ) ax.legend(df.columns, fontsize=12, ncol=6, loc='center' ,bbox_to_anchor=(0., -0.23, 1., .102) ) ax.set_axisbelow(True) plt.rcParams['font.family'] = 'sans-serif' plt.rcParams['font.sans-serif'] = ['Noto Sans Display'] plt.subplots_adjust(left=0.08, bottom=0.15, right=0.99, top=0.9) plt.title("Tax revenue as % of GDP,2019 (OECD Revenue)", fontsize=26) plt.tick_params(labelsize=10, pad=4) plt.ylabel("% of GDP", size=18) plt.ylim([0,50]) plt.xticks(rotation=60,fontsize=9) plt.yticks(fontsize=13) plt.minorticks_on() plt.grid(which='major',color='#999999',linestyle='-', axis="y") plt.grid(which='minor',color='#cccccc',linestyle='--', axis="y") plt.savefig("image.svg") ファイルの履歴
過去の版のファイルを表示するには、その版の日時をクリックしてください。
| 日付と時刻 | サムネイル | 寸法 | 利用者 | コメント | |
|---|---|---|---|---|---|
| 現在の版 | 2022年11月20日 (日) 12:19 | | 1,440 × 720 (155キロバイト) | Yuasan | 2019 data |
| 2017年1月23日 (月) 13:35 |  | 740 × 374 (155キロバイト) | Yuasan | fix | |
| 2017年1月23日 (月) 08:25 |  | 740 × 374 (140キロバイト) | Yuasan | 2014 year | |
| 2016年2月1日 (月) 05:54 |  | 747 × 395 (118キロバイト) | Yuasan | fix | |
| 2015年3月11日 (水) 04:09 |  | 747 × 395 (84キロバイト) | Yuasan | fix | |
| 2015年3月4日 (水) 07:20 |  | 747 × 395 (86キロバイト) | Yuasan | User created page with UploadWizard |
ファイルの使用状況
以下の 14 ページがこのファイルを使用しています: