ファイル:TV pic3.png
 ウィキペディアから無料の百科事典

このプレビューのサイズ: 732 × 600 ピクセル。 その他の解像度: 293 × 240 ピクセル | 586 × 480 ピクセル | 786 × 644 ピクセル。
元のファイル (786 × 644 ピクセル、ファイルサイズ: 11キロバイト、MIME タイプ: image/png)
ウィキメディア・コモンズのファイルページにある説明を、以下に表示します。 |
概要
 | このファイルのベクター画像 (SVG) が利用できます。 使う目的に対し、元画像よりもSVGがより優れている場合、SVG画像を使用して下さい。 File:TV pic3.png → File:X^2sin(x^-1).svg | .svg) |
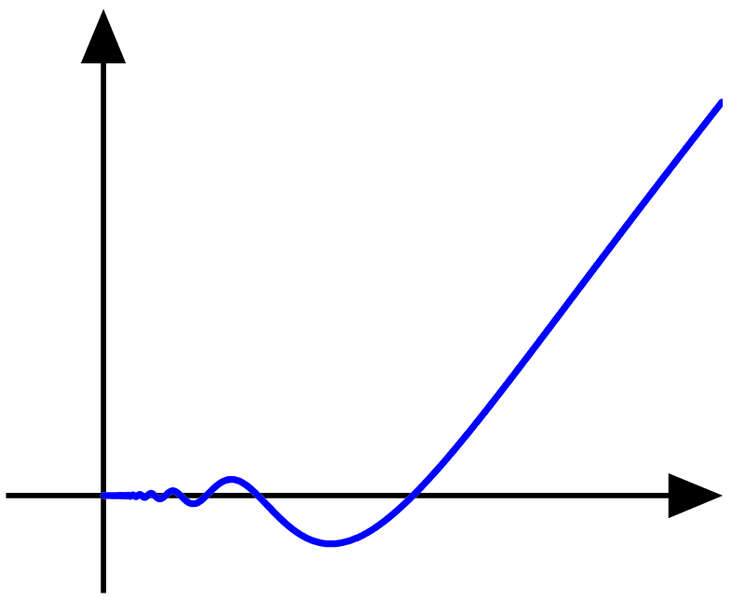
| 解説 | English: The function f(x)=x2 sin(1/x) for x>0. 日本語: f2 は原点で微分可能. Nederlands: De functie f(x)=x2 sin(1/x) voor x>0. Português: A função f(x)=x2 sin(1/x) para x>0. Svenska: Funktionen f(x)=x2 sin(1/x), för x>0. |
| 原典 | Self made, with MATLAB |
| 作者 | Oleg Alexandrov 08:56, 19 July 2007 (UTC) |
ライセンス
| この著作物の著作権者である私は、この著作物における権利を放棄しパブリックドメインとします。これは全世界で適用されます。 一部の国では、これが法的に可能ではない場合があります。その場合は、次のように宣言します。 私は、あらゆる人に対して、法により必要とされている条件を除き、如何なる条件も課すことなく、あらゆる目的のためにこの著作物を使用する権利を与えます。 |
Source code (MATLAB)
function discontinuity() % set up the plotting window thick_line=2.5; thin_line=2; arrow_size=3; arrow_type=2; fs=30; circrad=0.06; a=0; b=2/pi; h=0.0001; x0=1; X=a:h:b; f=inline('X.^2'); Y=f(X).*sin(1./(X+eps)); figure(3); clf; hold on; axis equal; axis off; Q=-0.1; R=2/pi; arrow([Q 0], [R, 0], thin_line, arrow_size, pi/8,arrow_type, [0, 0, 0]) % xaxis arrow([0 Q], [0, 0.5], thin_line, arrow_size, pi/8,arrow_type, [0, 0, 0]); % y axis plot(X, Y, 'linewidth', thick_line); axis ([-0.2, R, -0.3, R]); saveas(gcf, 'TV_pic3.eps', 'psc2'); function arrow(start, stop, thickness, arrowsize, sharpness, arrow_type, color) % draw a line with an arrow at the end % start is the x,y point where the line starts % stop is the x,y point where the line stops % thickness is an optional parameter giving the thickness of the lines % arrowsize is an optional argument that will give the size of the arrow % It is assumed that the axis limits are already set % 0 < sharpness < pi/4 determines how sharp to make the arrow % arrow_type draws the arrow in different styles. Values are 0, 1, 2, 3. % 8/4/93 Jeffery Faneuff % Copyright (c) 1988-93 by the MathWorks, Inc. % Modified by Oleg Alexandrov 2/16/03 if nargin <=6 color=[0, 0, 0]; end if (nargin <=5) arrow_type=0; % the default arrow, it looks like this: -> end if (nargin <=4) sharpness=pi/4; % the arrow sharpness - default = pi/4 end if nargin<=3 xl = get(gca,'xlim'); yl = get(gca,'ylim'); xd = xl(2)-xl(1); yd = yl(2)-yl(1); arrowsize = (xd + yd) / 2; % this sets the default arrow size end if (nargin<=2) thickness=0.5; % default thickness end xdif = stop(1) - start(1); ydif = stop(2) - start(2); if (xdif == 0) if (ydif >0) theta=pi/2; else theta=-pi/2; end else theta = atan(ydif/xdif); % the angle has to point according to the slope end if(xdif>=0) arrowsize = -arrowsize; end if (arrow_type == 0) % draw the arrow like two sticks originating from its vertex xx = [start(1), stop(1),(stop(1)+0.02*arrowsize*cos(theta+sharpness)),NaN,stop(1),... (stop(1)+0.02*arrowsize*cos(theta-sharpness))]; yy = [start(2), stop(2), (stop(2)+0.02*arrowsize*sin(theta+sharpness)),NaN,stop(2),... (stop(2)+0.02*arrowsize*sin(theta-sharpness))]; plot(xx,yy, 'LineWidth', thickness, 'color', color) end if (arrow_type == 1) % draw the arrow like an empty triangle xx = [stop(1),(stop(1)+0.02*arrowsize*cos(theta+sharpness)), ... stop(1)+0.02*arrowsize*cos(theta-sharpness)]; xx=[xx xx(1) xx(2)]; yy = [stop(2),(stop(2)+0.02*arrowsize*sin(theta+sharpness)), ... stop(2)+0.02*arrowsize*sin(theta-sharpness)]; yy=[yy yy(1) yy(2)]; plot(xx,yy, 'LineWidth', thickness, 'color', color) % plot the arrow stick plot([start(1) stop(1)+0.02*arrowsize*cos(theta)*cos(sharpness)], [start(2), stop(2)+ ... 0.02*arrowsize*sin(theta)*cos(sharpness)], 'LineWidth', thickness, 'color', color) end if (arrow_type==2) % draw the arrow like a full triangle xx = [stop(1),(stop(1)+0.02*arrowsize*cos(theta+sharpness)), ... stop(1)+0.02*arrowsize*cos(theta-sharpness),stop(1)]; yy = [stop(2),(stop(2)+0.02*arrowsize*sin(theta+sharpness)), ... stop(2)+0.02*arrowsize*sin(theta-sharpness),stop(2)]; H=fill(xx, yy, color);% fill with black set(H, 'EdgeColor', 'none') % plot the arrow stick plot([start(1) stop(1)+0.01*arrowsize*cos(theta)], [start(2), stop(2)+ ... 0.01*arrowsize*sin(theta)], 'LineWidth', thickness, 'color', color) end if (arrow_type==3) % draw the arrow like a filled 'curvilinear' triangle curvature=0.5; % change here to make the curved part more curved (or less curved) radius=0.02*arrowsize*max(curvature, tan(sharpness)); x1=stop(1)+0.02*arrowsize*cos(theta+sharpness); y1=stop(2)+0.02*arrowsize*sin(theta+sharpness); x2=stop(1)+0.02*arrowsize*cos(theta)*cos(sharpness); y2=stop(2)+0.02*arrowsize*sin(theta)*cos(sharpness); d1=sqrt((x1-x2)^2+(y1-y2)^2); d2=sqrt(radius^2-d1^2); d3=sqrt((stop(1)-x2)^2+(stop(2)-y2)^2); center(1)=stop(1)+(d2+d3)*cos(theta); center(2)=stop(2)+(d2+d3)*sin(theta); alpha=atan(d1/d2); Alpha=-alpha:0.05:alpha; xx=center(1)-radius*cos(Alpha+theta); yy=center(2)-radius*sin(Alpha+theta); xx=[xx stop(1) xx(1)]; yy=[yy stop(2) yy(1)]; H=fill(xx, yy, color);% fill with black set(H, 'EdgeColor', 'none') % plot the arrow stick plot([start(1) center(1)-radius*cos(theta)], [start(2), center(2)- ... radius*sin(theta)], 'LineWidth', thickness, 'color', color); end ファイルの履歴
過去の版のファイルを表示するには、その版の日時をクリックしてください。
| 日付と時刻 | サムネイル | 寸法 | 利用者 | コメント | |
|---|---|---|---|---|---|
| 現在の版 | 2007年2月25日 (日) 06:28 | | 786 × 644 (11キロバイト) | Oleg Alexandrov |
ファイルの使用状況
以下のページがこのファイルを使用しています:
グローバルなファイル使用状況
以下に挙げる他のウィキがこの画像を使っています:
- ca.wikipedia.org での使用状況
- nl.wikipedia.org での使用状況
- pt.wikipedia.org での使用状況
- sv.wikipedia.org での使用状況