ファイル:Estimations of Human Brain Emulation Required Performance.svg
 ウィキペディアから無料の百科事典

この SVG ファイルのこの PNG プレビューのサイズ: 800 × 600 ピクセル. その他の解像度: 320 × 240 ピクセル | 640 × 480 ピクセル | 1,024 × 768 ピクセル | 1,280 × 960 ピクセル | 2,560 × 1,920 ピクセル。
元のファイル (SVG ファイル、800 × 600 ピクセル、ファイルサイズ: 49キロバイト)
ウィキメディア・コモンズのファイルページにある説明を、以下に表示します。 |
概要
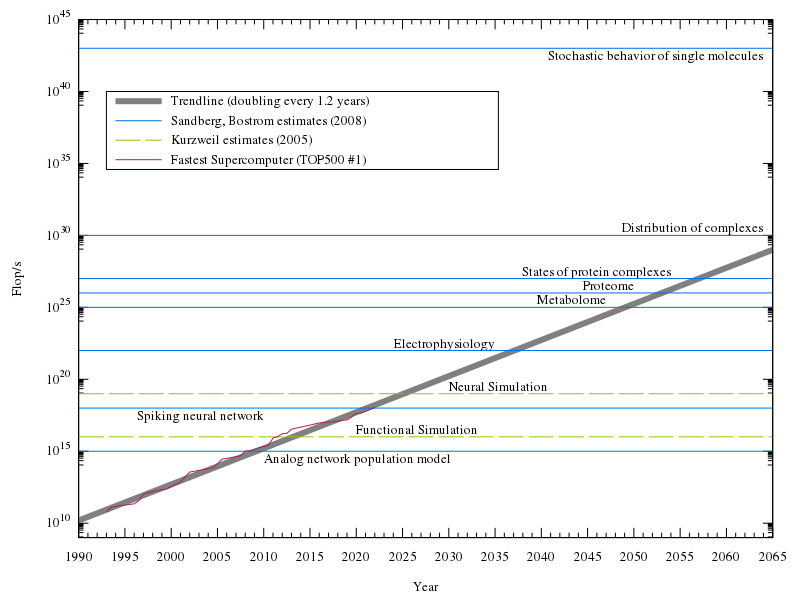
| 解説 | English: Estimates of how much processing power is needed to emulate a human brain at various levels, along with the fastest supercomputer from TOP500 mapped by year, and a trendline. Exponential plot, with assumption of doubling of computational power every 1.1 years for the trendline. |
| 日付 | |
| 原典 | 投稿者自身による著作物, data from [1], PPTSuperComputersPRINT.jpg, and [2]. |
| 作者 | Tga.D |
| SVG 開発 | |
| ソースコード | Gnuplot codeset terminal svg size 800 600 fname "Times,13" set output "Estimations of Human Brain Emulation Required Performance.svg" set notitle set key reverse Left left at 1993, 10**40 noautotitles box # good chunk of whitespace to put the key in set datafile separator "," set logscale y # use a logarithmic scale, for easier visualization of exponential growth set format y "10^{%T}" set yrange[10**9:10**45] set ylabel "Flop/s" set xrange [1990:2065] set xlabel "Year" set xtics 1990,5,2065 set mxtics 5 #set grid # I think it looks better without, but it's a matter of preference # labels for each of the levels of emulation set label "Analog network population model" at 2010, 10**14.5 left set label "Spiking neural network" at 2010, 10**17.5 right set label "Electrophysiology" at 2035, 10**22.5 right set label "Metabolome" at 2047, 10**25.5 right set label "Proteome" at 2050, 10**26.5 right set label "States of protein complexes" at 2054, 10**27.5 right set label "Distribution of complexes" at 2064, 10**30.5 right set label "Stochastic behavior of single molecules" at 2064, 10**42.5 right set label "Functional Simulation" at 2020, 10**16.5 left set label "Neural Simulation" at 2030, 10**19.5 left # best-fit is as of June 2022 list, to two sigfigs # horizontal lines plotted to represent levels of emulation # plot of historical TOP500 #1's stored in a .csv # colors and sizes picked from what I thought was easiest to see # titles done for one of each type of line, for the key plot 87000000000.0*(2**((x-1993)/1.2)) lw 6 lc 0 w lines title "Trendline (doubling every 1.2 years)",\ 10**15 ls 3 lt rgb "#0073E6", \ 10**18 ls 3 lt rgb "#0073E6", \ 10**22 ls 3 lt rgb "#0073E6", \ 10**25 ls 3 lt rgb "#0073E6", \ 10**26 ls 3 lt rgb "#0073E6", \ 10**27 ls 3 lt rgb "#0073E6", \ 10**30 ls 3 lt rgb "#0073E6", \ 10**43 ls 3 lt rgb "#0073E6" title "Sandberg, Bostrom estimates (2008)",\ 10**16 ls 2 dt (50,10) lc rgb "#89CE00", \ 10**19 ls 2 dt (50,10) lt rgb "#89CE00" title "Kurzweil estimates (2005)",\ "TOP500.csv" using 1:2 ls 1 lt rgb "#B51963" pt 7 ps .5 with linespoints title "Fastest Supercomputer (TOP500 #1)" DataThe #1 computer over the years from TOP500, used to generate the supercomputer line at the end of the Gnuplot code. The name of each supercomputer is in the file, but unused in the code/chart. Whole number years represent a June list, .5 represents a November list. Year,Flop/s,Name 1993,59700000000,CM-5/1024 1993.5,124000000000,Numerical Wind Tunnel 1994,143400000000,XP/S140 1994.5,170000000000,Numerical Wind Tunnel 1996,220400000000,SR2201/1024 1996.5,368200000000,CP-PACS/2048 1997,1068000000000,ASCI Red 1997.5,1338000000000,ASCI Red 1999,2121000000000,ASCI Red 1999.5,2379000000000,ASCI Red 2000.5,4938000000000,ASCI White 2001,7226000000000,ASCI White 2002,35860000000000,Earth-Simulator 2004.5,70720000000000,BlueGene/L beta-System 2005,136800000000000,BlueGene/L 2005.5,280600000000000,BlueGene/L 2007.5,478200000000000,BlueGene/L 2008,1026000000000000,Roadrunner 2008.5,1105000000000000,Roadrunner 2009.5,1759000000000000,Jaguar 2010.5,2566000000000000,Tianhe-1A 2011,8162000000000000,K computer 2011.5,10510000000000000,K computer 2012,16324800000000000,Sequoia 2012.5,17590000000000000,Titan 2013,33862700000000000,Tianhe-2A 2016,93014600000000000,Sunway TaihuLight 2018,122300000000000000,Summit 2018.5,143500000000000000,Summit 2020,415530000000000000,Fugaku 2020.5,442000000000000000,Fugaku 2022,1102000000000000000,Frontier |
ライセンス
この作品の著作権者である私は、この作品を以下のライセンスで提供します。
このファイルはクリエイティブ・コモンズ 表示-継承 3.0 非移植ライセンスのもとに利用を許諾されています。
- あなたは以下の条件に従う場合に限り、自由に
- 共有 – 本作品を複製、頒布、展示、実演できます。
- 再構成 – 二次的著作物を作成できます。
- あなたの従うべき条件は以下の通りです。
- 表示 – あなたは適切なクレジットを表示し、ライセンスへのリンクを提供し、変更があったらその旨を示さなければなりません。これらは合理的であればどのような方法で行っても構いませんが、許諾者があなたやあなたの利用行為を支持していると示唆するような方法は除きます。
- 継承 – もしあなたがこの作品をリミックスしたり、改変したり、加工した場合には、あなたはあなたの貢献部分を元の作品とこれと同一または互換性があるライセンスの下に頒布しなければなりません。
ファイルの履歴
過去の版のファイルを表示するには、その版の日時をクリックしてください。
| 日付と時刻 | サムネイル | 寸法 | 利用者 | コメント | |
|---|---|---|---|---|---|
| 現在の版 | 2023年2月22日 (水) 00:40 | | 800 × 600 (49キロバイト) | Tga.D | updated data, fixed colors and styles to be more color blind-friendly |
| 2022年3月7日 (月) 16:11 |  | 800 × 600 (37キロバイト) | Daemon2010 | Added Fugaku | |
| 2019年2月20日 (水) 06:32 |  | 800 × 600 (45キロバイト) | Tga.D | Increase font size; adjust label positions | |
| 2019年2月20日 (水) 06:15 |  | 800 × 600 (45キロバイト) | Tga.D | Regenerated with a newer version of gnuplot, and more recent TOP500 data. Opted to not update the trendline, as the divergence from expected seems more relevant. | |
| 2013年6月18日 (火) 22:20 |  | 800 × 600 (34キロバイト) | Tga.D | New #1 on the TOP 500 June 2013 list. | |
| 2012年12月24日 (月) 01:07 |  | 800 × 600 (34キロバイト) | Tga.D | large mediawiki-generated png versions had messed up spacing in the key, switching the order to see if it fixes it | |
| 2012年12月24日 (月) 00:29 |  | 800 × 600 (34キロバイト) | Tga.D | User created page with UploadWizard |
ファイルの使用状況
以下のページがこのファイルを使用しています:
グローバルなファイル使用状況
以下に挙げる他のウィキがこの画像を使っています:
- ar.wikipedia.org での使用状況
- bs.wikipedia.org での使用状況
- ca.wikipedia.org での使用状況
- en.wikipedia.org での使用状況
- es.wikipedia.org での使用状況
- fa.wikipedia.org での使用状況
- fr.wikipedia.org での使用状況
- gl.wikipedia.org での使用状況
- he.wikipedia.org での使用状況
- hu.wikipedia.org での使用状況
- id.wikipedia.org での使用状況
- ru.wikipedia.org での使用状況
- th.wikipedia.org での使用状況
- uk.wikipedia.org での使用状況
- zh.wikipedia.org での使用状況