ファイル:Jack Fingleton graph.png
 ウィキペディアから無料の百科事典

このプレビューのサイズ: 800 × 409 ピクセル。 その他の解像度: 320 × 163 ピクセル | 640 × 327 ピクセル | 963 × 492 ピクセル。
元のファイル (963 × 492 ピクセル、ファイルサイズ: 5キロバイト、MIME タイプ: image/png)
ウィキメディア・コモンズのファイルページにある説明を、以下に表示します。 |
概要
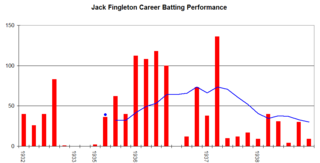
| 解説 | English: This graph details the Test Match performance of Jack Fingleton. It was created by Raven4x4x. The red bars indicate the player's test match innings, while the blue line shows the average of the ten most recent innings at that point. Note that this average cannot be calculated for the first nine innings. The blue dots indicate innings in which Fingleton finished not-out. This graph was generated with Microsoft Excel 2002, using data from Cricinfo and Howstat.com.au. |
| 日付 | 2006年2月8日 (当初のアップロード日) |
| 原典 | 投稿者自身による著作物 Transferred from en.wikipedia |
| 作者 | Raven4x4x at en.wikipedia |
ライセンス
| | このファイルは、ウィキメディア・コモンズ版プロジェクトにおいて、著作者であるRaven4x4xによりその権利が放棄され、パブリックドメインの状態にあります。これは全世界で適用されます。 一部の国では、これが法的に可能ではない場合があります。その場合は、次のように宣言します。 Raven4x4xは、あらゆる人に対して、法により必要とされている条件を除き、如何なる条件も課すことなく、その目的を問わずこの著作物を利用する権利を与えます。 |
元のアップロードログ
元のファイルページはこちら。以下の利用者は全てen.wikipediaに属します。
- 2006-02-08 03:54 Raven4x4x 963×492 (4700 bytes) This graph details the [[Test cricket|Test Match]] performance of [[Jack Fingleton]]. It was created by [[User:Raven4x4x|Raven4x4x]]. The red bars indicate the player's test match innings, while the blue line shows the [[Batting average|average]] of the t
ファイルの履歴
過去の版のファイルを表示するには、その版の日時をクリックしてください。
| 日付と時刻 | サムネイル | 寸法 | 利用者 | コメント | |
|---|---|---|---|---|---|
| 現在の版 | 2010年7月27日 (火) 22:29 | | 963 × 492 (5キロバイト) | MGA73bot2 | == {{int:filedesc}} == {{Information |description={{en|1=This graph details the Test Match performance of Jack Fingleton. It was created by Raven4x4x. The red bars indicate the player's te |
ファイルの使用状況
このファイルを使用しているページはありません。
グローバルなファイル使用状況
以下に挙げる他のウィキがこの画像を使っています:
- en.wikipedia.org での使用状況