Villematier

Villematier | |
|---|---|
 The church in Villematier | |
.svg) Coat of arms | |
Location of Villematier  | |
 Villematier  Villematier | |
| Coordinates: 43°49′48″N 1°30′33″E / 43.83°N 1.5092°E | |
| Country | France |
| Region | Occitania |
| Department | Haute-Garonne |
| Arrondissement | Toulouse |
| Canton | Villemur-sur-Tarn |
| Intercommunality | Val'Aïgo |
| Government | |
| • Mayor (2020–2026) | Jean-Michel Jilibert[1] |
| Area 1 | 14.96 km2 (5.78 sq mi) |
| Population (2021)[2] | 1,097 |
| • Density | 73/km2 (190/sq mi) |
| Time zone | UTC+01:00 (CET) |
| • Summer (DST) | UTC+02:00 (CEST) |
| INSEE/Postal code | 31583 /31340 |
| Elevation | 85–156 m (279–512 ft) (avg. 103 m or 338 ft) |
| 1 French Land Register data, which excludes lakes, ponds, glaciers > 1 km2 (0.386 sq mi or 247 acres) and river estuaries. | |
Villematier (French pronunciation: [vilmatje]; Occitan: Vilamatièr) is a commune in the Haute-Garonne department in southwestern France.
Geography[edit]
Climate[edit]
Villematier has a oceanic climate (Köppen climate classification Cfb) closely bordering on a humid subtropical climate (Cfa). The average annual temperature in Villematier is 13.5 °C (56.3 °F). The average annual rainfall is 722.1 mm (28.43 in) with April as the wettest month. The temperatures are highest on average in July, at around 21.8 °C (71.2 °F), and lowest in January, at around 5.7 °C (42.3 °F). The highest temperature ever recorded in Villematier was 41.0 °C (105.8 °F) on 4 August 2003; the coldest temperature ever recorded was −13.5 °C (7.7 °F) on 9 February 2012.
| Climate data for Villematier (1981−2010 normals, extremes 1994−2016) | |||||||||||||
|---|---|---|---|---|---|---|---|---|---|---|---|---|---|
| Month | Jan | Feb | Mar | Apr | May | Jun | Jul | Aug | Sep | Oct | Nov | Dec | Year |
| Record high °C (°F) | 19.5 (67.1) | 24.5 (76.1) | 27.0 (80.6) | 31.0 (87.8) | 34.5 (94.1) | 40.0 (104.0) | 39.5 (103.1) | 41.0 (105.8) | 37.0 (98.6) | 32.0 (89.6) | 25.0 (77.0) | 20.5 (68.9) | 41.0 (105.8) |
| Mean daily maximum °C (°F) | 10.2 (50.4) | 12.0 (53.6) | 16.0 (60.8) | 18.7 (65.7) | 22.9 (73.2) | 27.1 (80.8) | 29.0 (84.2) | 28.9 (84.0) | 25.3 (77.5) | 20.9 (69.6) | 13.7 (56.7) | 10.0 (50.0) | 19.6 (67.3) |
| Daily mean °C (°F) | 5.7 (42.3) | 6.7 (44.1) | 9.5 (49.1) | 12.1 (53.8) | 16.4 (61.5) | 20.2 (68.4) | 21.8 (71.2) | 21.7 (71.1) | 17.9 (64.2) | 14.6 (58.3) | 8.8 (47.8) | 5.8 (42.4) | 13.5 (56.3) |
| Mean daily minimum °C (°F) | 1.1 (34.0) | 1.3 (34.3) | 3.1 (37.6) | 5.5 (41.9) | 9.9 (49.8) | 13.3 (55.9) | 14.6 (58.3) | 14.4 (57.9) | 10.5 (50.9) | 8.4 (47.1) | 3.9 (39.0) | 1.5 (34.7) | 7.3 (45.1) |
| Record low °C (°F) | −9.5 (14.9) | −13.5 (7.7) | −10.0 (14.0) | −2.5 (27.5) | 2.0 (35.6) | 5.0 (41.0) | 7.0 (44.6) | 5.0 (41.0) | 2.0 (35.6) | −4.0 (24.8) | −8.5 (16.7) | −11.0 (12.2) | −13.5 (7.7) |
| Average precipitation mm (inches) | 62.4 (2.46) | 49.7 (1.96) | 49.4 (1.94) | 77.4 (3.05) | 72.2 (2.84) | 54.1 (2.13) | 43.2 (1.70) | 51.5 (2.03) | 67.8 (2.67) | 61.5 (2.42) | 67.6 (2.66) | 65.3 (2.57) | 722.1 (28.43) |
| Average precipitation days (≥ 1.0 mm) | 11.6 | 9.3 | 8.8 | 10.6 | 10.1 | 7.0 | 6.1 | 6.9 | 8.4 | 8.9 | 11.8 | 11.4 | 110.9 |
| Source: Météo-France[3] | |||||||||||||
Population[edit]
| Year | Pop. | ±% |
|---|---|---|
| 1962 | 557 | — |
| 1968 | 652 | +17.1% |
| 1975 | 714 | +9.5% |
| 1982 | 827 | +15.8% |
| 1990 | 828 | +0.1% |
| 1999 | 861 | +4.0% |
| 2008 | 971 | +12.8% |
Sights[edit]
-
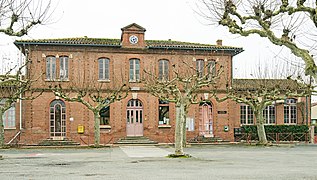 Town hall

See also[edit]
References[edit]
- ^ "Répertoire national des élus: les maires". data.gouv.fr, Plateforme ouverte des données publiques françaises (in French). 2 December 2020.
- ^ "Populations légales 2021". The National Institute of Statistics and Economic Studies. 28 December 2023.
- ^ "Fiche Climatologique Statistiques 1981-2010 et records" (PDF). Météo-France. Retrieved 21 August 2022.
| Authority control databases: National |
|---|
This Haute-Garonne geographical article is a stub. You can help Wikipedia by expanding it. |