Файл:Map of Jupiter (square).jpg
 Из Википедии, бесплатной энциклопедии
Размер этого предпросмотра: 600 × 600 пкс. Другие разрешения: 240 × 240 пкс | 480 × 480 пкс | 768 × 768 пкс | 1024 × 1024 пкс | 2160 × 2160 пкс.
Исходный файл (2160 × 2160 пкс, размер файла: 409 КБ, MIME-тип: image/jpeg)
Этот файл находится на Викискладе. Сведения о нём показаны ниже. Викисклад — централизованное хранилище для свободных файлов, используемых в проектах Викимедиа. |
Краткое описание
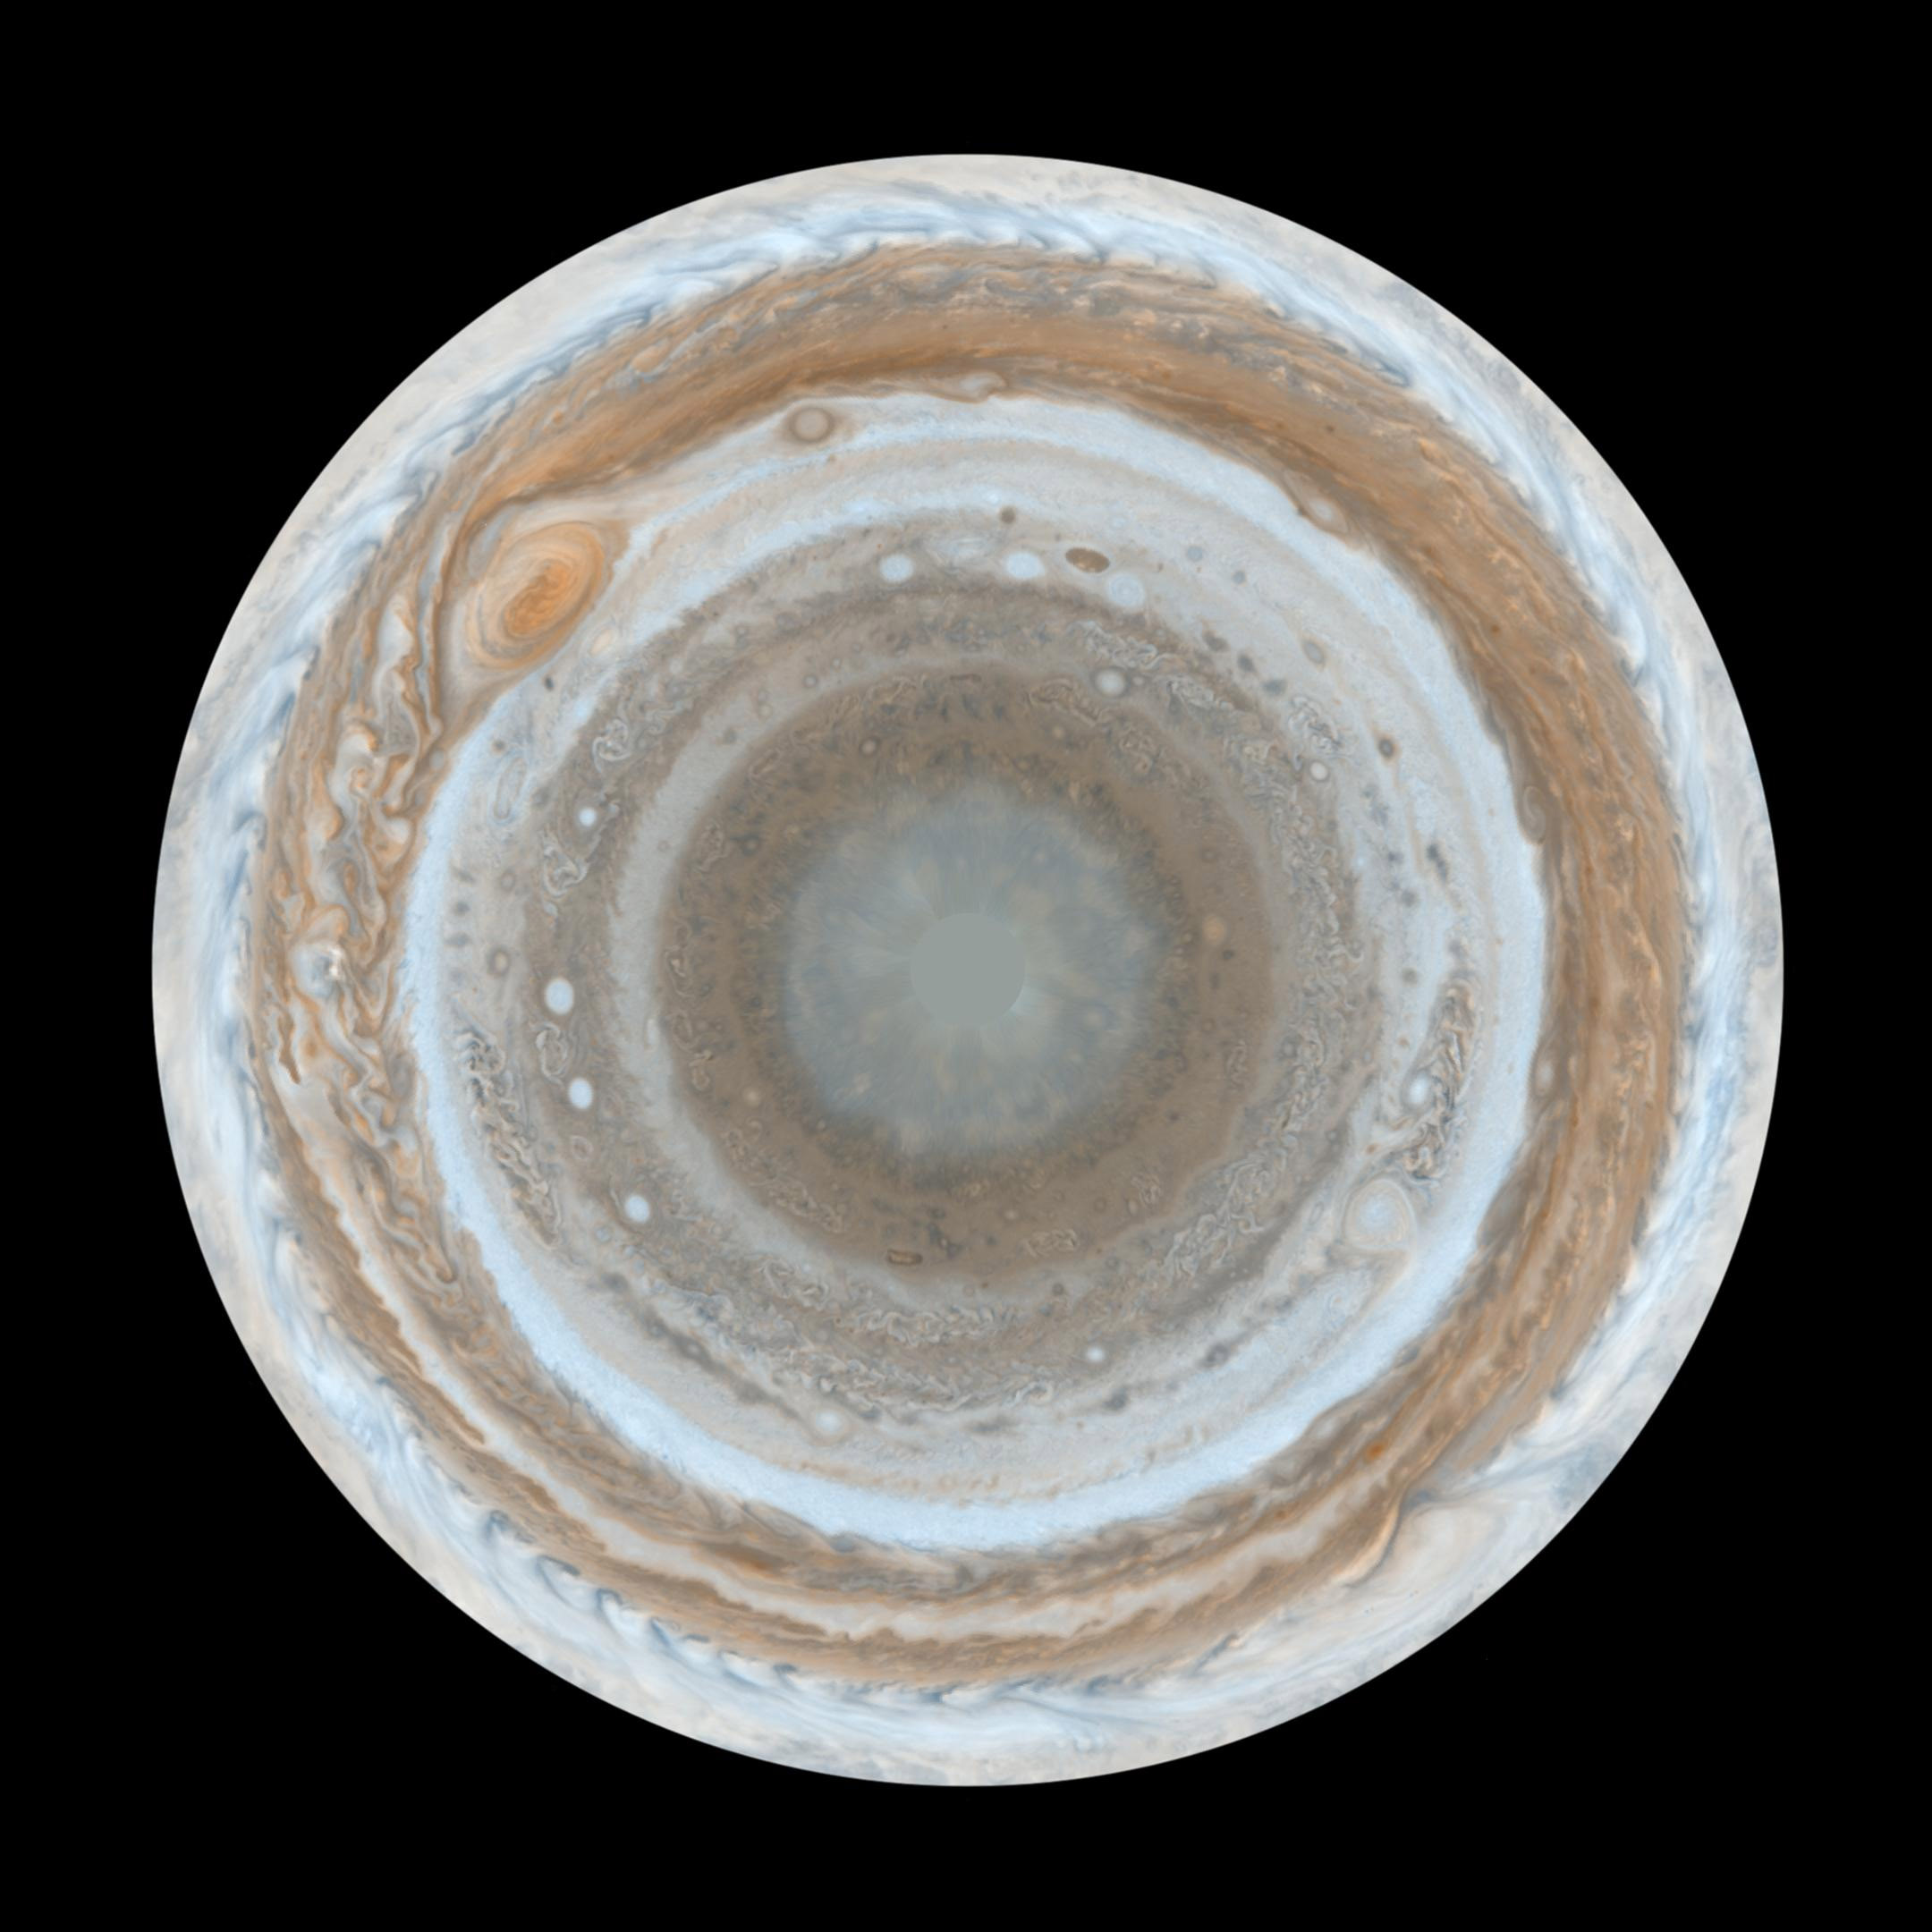
| Описание | English: :This map of Jupiter is the most detailed global color map of the planet ever produced. The round map is a polar stereographic projection that shows the south pole in the center of the map and the equator at the edge. It was constructed from images taken by Cassini on Dec. 11 and 12, 2000, as the spacecraft neared Jupiter during a flyby on its way to Saturn. The map shows a variety of colorful cloud features, including parallel reddish-brown and white bands, the Great Red Spot, multi-lobed chaotic regions, white ovals and many small vortices. Many clouds appear in streaks and waves due to continual stretching and folding by Jupiter's winds and turbulence. The bluish-gray features along the north edge of the central bright band are equatorial "hot spots," meteorological systems such as the one entered by NASA's Galileo probe. Small bright spots within the orange band north of the equator are lightning-bearing thunderstorms. The polar region shown here is less clearly visible because Cassini viewed it at an angle and through thicker atmospheric haze. |
| Дата | 11-12 December 2000 |
| Источник | From http://www.nasa.gov/multimedia/imagegallery/image_feature_539.html |
| Автор | NASA/JPL/Space Science Institute |
| Права (Повторное использование этого файла) | PD-USGOV-NASA. |
| Другие версии | |


.jpg?uselang=ru)
Лицензирование
| Этот файл находится в общественном достоянии (англ. public domain), так как он был создан NASA (Национальным управлением по аэронавтике и исследованию космического пространства). Политика авторского права NASA гласит, что «Материал NASA не защищается авторским правом, если не указано иное». (См. Template:PD-USGov, страницу политики авторского права NASA или политику использования изображений JPL.) | ||
 | Предупреждения:
|
История файла
Нажмите на дату/время, чтобы посмотреть файл, который был загружен в тот момент.
| Дата/время | Миниатюра | Размеры | Участник | Примечание | |
|---|---|---|---|---|---|
| текущий | 00:00, 1 декабря 2019 | | 2160 × 2160 (409 КБ) | User-duck | File:Map of Jupiter.jpg cropped square using CropTool with lossless mode. |
Использование файла
Нет страниц, использующих этот файл.
Глобальное использование файла
Данный файл используется в следующих вики:
- Использование в en.wikipedia.org
- Использование в ko.wikipedia.org
- Использование в ro.wikipedia.org
- Использование в uk.wikipedia.org
.jpg)