1989 United Kingdom local elections
 From Wikipedia the free encyclopedia
| |||||||||||||||||||||||||||||
All 39 non-metropolitan counties, 1 sui generis authority, all 26 Northern Irish districts and all 8 Welsh counties | |||||||||||||||||||||||||||||
|---|---|---|---|---|---|---|---|---|---|---|---|---|---|---|---|---|---|---|---|---|---|---|---|---|---|---|---|---|---|
| |||||||||||||||||||||||||||||
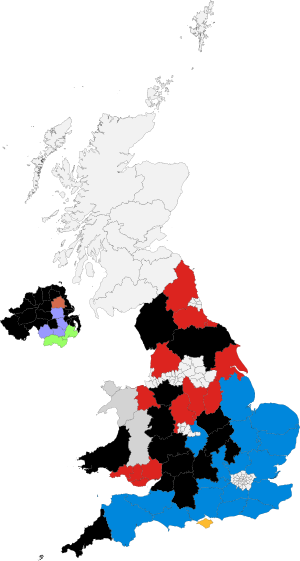
 Colours denote the winning party, as shown in the main table of results. | |||||||||||||||||||||||||||||
The 1989 United Kingdom local elections were held on Thursday 4 May 1989 in England and Wales, and Wednesday 17 May 1989 in Northern Ireland.[1][2] The Labour Party had the highest projected national vote share, but the Conservative Party, in power at Westminster, gained the most seats. On the same day, there was a parliamentary by-election in the Vale of Glamorgan constituency in Wales; Labour won the seat from the Conservatives.
The national projected share of the vote was Labour 42%, Conservative 36%, Liberal Democrats 19%. The Conservatives gained 92 seats, Labour gained 35 seats and the Liberal Democrats lost 175 seats. It was Labour's largest share of the vote in any election in a decade, as the party's popularity continued to improve as a result of the ongoing modernisation process under Neil Kinnock, and that the Conservative government's popularity was starting to fall following the announcement of the poll tax.
Summary of results
[edit]This section is empty. You can help by adding to it. (September 2015) |
England
[edit]Non-metropolitan county councils
[edit]Sui generis
[edit]| Council | Previous control | Result | Details | ||
|---|---|---|---|---|---|
| Isles of Scilly | Details | ||||
Northern Ireland
[edit]Wales
[edit]County councils
[edit]| Council | Previous control | Result | Details | ||
|---|---|---|---|---|---|
| Clwyd | No overall control | Labour gain | Details | ||
| Dyfed | No overall control | No overall control hold | Details | ||
| Gwent | Labour | Labour hold | Details | ||
| Gwynedd | Independent | Independent hold | Details | ||
| Mid Glamorgan | Labour | Labour hold | Details | ||
| Powys | Independent | Independent hold | Details | ||
| South Glamorgan | Labour | Labour hold | Details | ||
| West Glamorgan | Labour | Labour hold | Details | ||
References
[edit]- ^ Rallings, Colin; Thrasher, Michael. Local Elections Handbook 1989, Volume 1. The Elections Centre. Retrieved 3 May 2016.
- ^ "Council compositions". The Elections Centre. Retrieved 3 May 2016.


