September 1921 San Antonio floods
 From Wikipedia the free encyclopedia
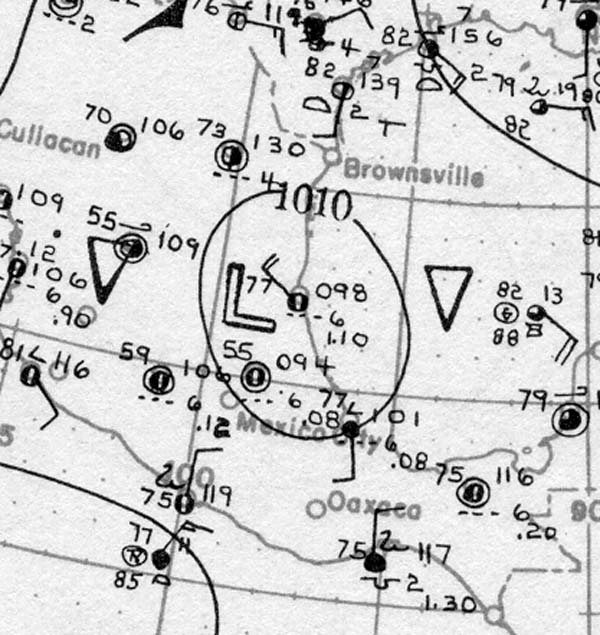
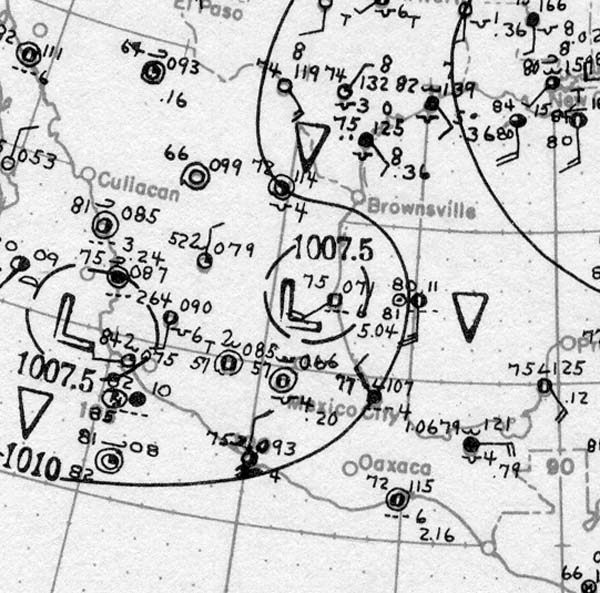
 Surface weather analysis of the hurricane on September 7 after making landfall | |
| Date | September 7 – September 11, 1921 |
|---|---|
| Location | Mexico, Texas |
| Deaths | 215 total |
| Property damage | $19 million (1921 USD) |
In early September 1921, the remnants of a Category 1 hurricane brought damaging floods to areas of Mexico and the U.S. state of Texas, particularly in the San Antonio region. On September 4, a tropical cyclone developed in the southwestern Gulf of Mexico near the Bay of Campeche. Moving slowly in a general westward direction, the disturbance reached hurricane intensity on September 7 prior to making landfall south of Tampico, Mexico the following day. The storm weakened over land, and lost cyclonic characteristics later that day. However, a nearby high-pressure area forced the remnants of the system northward into Texas. Due to an orographic lifting effect, the remnants were able to produce torrential and record rainfall over the state. Precipitation peaked over Central Texas, where the highest rainfall amount measured was 40 in (1,016 mm) near Thrall, Texas; this was the fourth-highest tropical cyclone-related rainfall total in Texas since record keeping began. Similarly, an observation of 36.40 in (925 mm) elsewhere in Williamson County, Texas ranked as the sixth-highest tropical cyclone-related rainfall total for the state. The high precipitation totals set nationwide records which would stand for several years.
Meteorological history[edit]

Tropical storm (39–73 mph, 63–118 km/h)
Category 1 (74–95 mph, 119–153 km/h)
Category 2 (96–110 mph, 154–177 km/h)
Category 3 (111–129 mph, 178–208 km/h)
Category 4 (130–156 mph, 209–251 km/h)
Category 5 (≥157 mph, ≥252 km/h)
Unknown
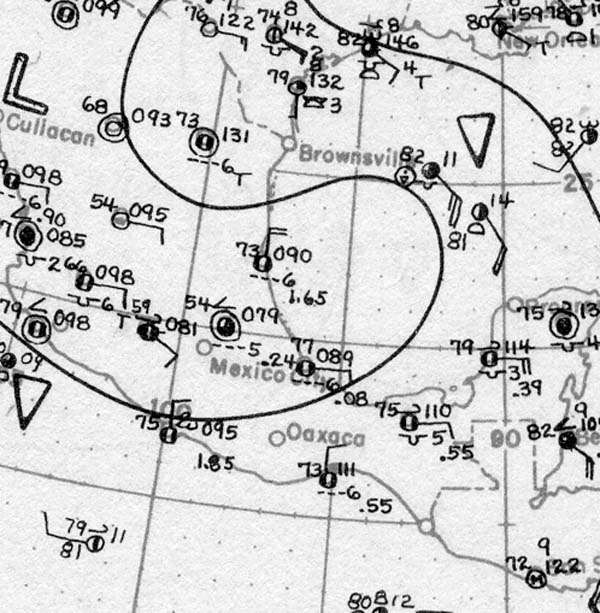
In early September, a trough of low-pressure persisted in the southwestern Gulf of Mexico, near the Bay of Campeche.[1] The area of disturbed weather gradually organized, and was analyzed to have become a tropical depression by 1200 UTC on September 4. In its initial stages after tropical cyclogenesis, the disturbance moved very slowly and did not intensify.[2] Its lack of organization resulted in its estimated misplacement inland over Mexico in the Signal Corps's weather map for September 5.[3][4] At the time, the storm was estimated to have a minimum barometric pressure of at least 1010 mbar (hPa; 29.83 inHg).[3] The system remained a tropical depression until 0000 UTC on September 6, when it was estimated to have attained tropical storm intensity.[1] Despite the analyzed intensification, the updated Signal Corps weather maps for the tropical cyclone that day indicated that the system had degenerated back into an open trough.[1][5] Continuing to intensify throughout the day, the tropical storm was estimated to have reached hurricane intensity by the following day.[2]
Shortly after, the hurricane made landfall south of Tampico, Mexico near La Leja at 0300 UTC on September 7.[6][7][1] At the time, the cyclone had maximum sustained winds of 80 mph (130 km/h), making it a Category 1 on the modern-day Saffir–Simpson hurricane wind scale. The storm's minimum barometric pressure at landfall was 985 mbar (hPa; 29.10 inHg); this would be the lowest pressure estimated in association with the storm, though it was not included in HURDAT. Just prior to landfall at 0100 UTC, a ship had reported winds of 80 mph (130 km/h) from the southeast and a pressure of 996 mbar (hPa; 29.42 inHg). Upon landfall, a barometer in Tampico reported a minimum pressure of 1003 mbar (hPa; 29.62 inHg).[1] The Signal Corps map of the cyclone for September 7 indicated a pressure of at least 1007.5 mbar (hPa; 29.75 inHg) for the storm's outermost closed isobar, with a storm of similar nature positioned a short distance west of Jalisco, Mexico in the eastern Pacific Ocean.[8] Once inland, the hurricane weakened, and made a northward curve before degenerating into a remnant low after 0600 UTC on September 8.[2] The remnant low progressed northward, and moved into Texas from the state border with Mexico near Webb County. In Texas, moisture associated with the system and other contributing forces produced excessive rainfall over Central Texas, causing numerous rivers to overflow.[7]
Impact[edit]

Despite making landfall on Tamaulipas,[2] its impact in Mexico, if any, remains unknown.[1] However, the decaying remnants of the hurricane moved northward as the result of a retrograding high-pressure area over East Texas, helping to produce torrential precipitation across South and Central Texas.[7] The area of high-pressure was a westward extension of the Bermuda High, which is typically centered in the Central Atlantic. The pressure anomaly provided an abundant moisture supply to the region, increasing convergence. In addition, a separate tropical cyclone located near Barbados was able to alter the positioning of isobars over the area, such that heavy rainfall would result.[9] Precipitation was further aided by the Balcones Escarpment and Edwards Plateau, which provided orographic lift.[10] The rains caused severe flooding, particularly to low-lying areas.[7]
Due to the rapid accumulation of floodwaters, the United States Weather Bureau issued numerous flood warnings. The first warnings pertinent to the storm system were issued early on September 9 for areas adjacent to the Rio Grande between Rio Grande City and Brownsville. While the warnings for the Rio Grande were discontinued shortly after, areas near the Colorado River downstream of Austin were issued a flood warning on September 10. At the same time, flood warnings were posted for areas of the Brazos River from Valley Junction to Richmond; this specific warning was later extended further downstream to include Freeport. Similar warnings were issued for portions near the lower Guadalupe River on September 11. All warnings were later discontinued after the floods ended. Despite being affected by the floods, warnings were not issued for areas of the Nueces, San Antonio, and Little Rivers, due to a lack of river services.[7]
Though peak rainfall estimates have been widely disputed,[7][9][11] it has been most recently estimated that the peak precipitation amount in Texas associated with the storm to have been a recording of 40 in (1016 mm) in Thrall over a three-day period; this would make the storm the fourth wettest tropical cyclone to impact Texas since record keeping began. The same station had observed 38.20 in (971 mm) of precipitation in a 24-hour period,[11] as well as 32 in (813 mm) of rain in just 12 hours; this would be a national record.[10] Similarly, another location in Williamson County reported 36.40 in (925 mm) of rain in 18 hours, which would be a national record for most rainfall in its respective period.[7] In Thrall, the extreme rainfall washed out numerous roads and created deep gullies into the ground. In nearby Thorndale, rains estimated as high as 25 in (635 mm) caused streams to overflow, reaching levels unseen since the 1900 Galveston hurricane.[10]

When the remnants of the hurricane moved into Texas, they first impacted parts of the Rio Grande. Though rainfall was not considerable, a station in Laredo, which straddles the river, reported 6 in (152 mm) of precipitation. There, the river rose by 8.6 ft (2.6 mm). Since rainfall was mostly concentrated upstream of the mouth of the Rio Grande, the resulting river rises caused a wave of high water which pushed downstream. In Rio Grande City, the river rose 3 ft (0.9 m) above flood stage, though no damage resulted. Further north, the drainage basin of the Guadalupe River saw torrential rainfall and flooding. High precipitation observations in the drainage basin include 11.50 in (292 mm) in San Marcos, 9.56 in (243 mm) in New Braunfels, and 7.85 in (199 mm) in Blanco. In Gonzales, the Guadalupe River peaked at a crest of 31.4 ft (9.57 m), 9.4 ft (2.87 m) above flood stage on September 11. The unusually high crest damaged adjacent low-lying corn crops. Damages to Gonzales County totaled to $3,500. Though damage along the river was minor, damage due to the rain in Blanco, Hays, Comal, and Guadalupe Counties was estimated at $218,500.[7]
Rainfall was most concentrated around the Colorado River, particularly from September 9–10. The highest rainfall amount reported along the river was 19.03 in (483 mm) in Austin. There, the river rose by 18.2 ft (462 mm). Although the river itself did not cause any damage in the city, its creek tributaries caused severe devastation. Flood in Austin was estimated at $850,000, mostly to the city's road network. Squalls and other thunderstorms caused an additional $30,000 in damages in Austin and Creedmoor. The excess floodwaters moved downstream, inundating low-lying areas. In Smithville, the rising water levels submerged areas up to 2 mi (3 km) outwards from the river. Damages there were estimated at $8,000. Further south in La Grange, damage to crops, livestock, and property was valued at $17,250, though it was estimated that $20,000 in damages was mitigated by flood warnings. Losses to the corn crop were increased since the ground in the area was already highly saturated.[7]
Overall, the floods associated with the remnant tropical cyclone caused $19 million in property losses, particularly in the counties of Bell, Bexar, Milam, Travis, and Williamson. The floods also killed 215 people, greatly exceeding the 117 caused by floods in Texas in December 1913.[7]
Aftermath[edit]
The floods would spur the construction of Olmos Dam and a bypass channel in Downtown San Antonio.[12]
The original plans called for the bypass channel to be followed by creation of a paved-over storm sewer along a prominent bend of the river. However, that option was unpopular. Later, local architect Robert Hugman developed plans for commercial development of the bend, which ultimately became the world-famous San Antonio River Walk.
See also[edit]
Notes[edit]
References[edit]
- ^ a b c d e f Landsea, Chris; Atlantic Oceanic Meteorological Laboratory; et al. (December 2012). "Documentation of Atlantic Tropical Cyclones Changes in HURDAT". United States National Oceanic and Atmospheric Administration. Retrieved May 16, 2013.
- ^ a b c d "Atlantic hurricane best track (HURDAT version 2)" (Database). United States National Hurricane Center. April 5, 2023. Retrieved April 18, 2024.
 This article incorporates text from this source, which is in the public domain.
 - ^ a b United States Signal Corps (September 5, 1940). "Historical Weather Map for September 5, 1940" (JPG). Historical Weather Maps. United States National Oceanic and Atmospheric Administration's Atlantic Oceanographic and Meteorological Laboratory. Retrieved May 16, 2013.
{{cite web}}: External link in|work= - ^ NOAA Central Library (January 17, 2007). "U.S. Daily Weather Maps Project". United States National Oceanic and Atmospheric Administration's National Weather Service. Retrieved May 16, 2013.
- ^ United States Signal Corps (September 6, 1940). "Historical Weather Map for September 5, 1940" (JPG). Historical Weather Maps. United States National Oceanic and Atmospheric Administration's Atlantic Oceanographic and Meteorological Laboratory. Retrieved May 16, 2013.
{{cite web}}: External link in|work= - ^ Secretaria General de Gobierno, Coordinacion General de Proteccion Civil (June 2012). Plan de Contingencias - Temporada de Ciclones Tropicales 2012 (PDF) (Report) (in Spanish). Gobierno del Estado de Tamaulipas. p. 17. Retrieved May 18, 2013.
- ^ a b c d e f g h i j Bunnemeyer, B. (September 1, 1921). "The Texas Floods of September 1921 - General Discussion" (PDF). Monthly Weather Review. 49 (9). Houston, Texas: American Meteorological Society: 491–494. Bibcode:1921MWRv...49..491B. doi:10.1175/1520-0493(1921)49<491:GD>2.0.CO;2. Retrieved May 16, 2013.
- ^ United States Signal Corps (September 7, 1940). "Historical Weather Map for September 7, 1940" (JPG). Historical Weather Maps. United States National Oceanic and Atmospheric Administration's Atlantic Oceanographic and Meteorological Laboratory. Retrieved May 16, 2013.
{{cite web}}: External link in|work= - ^ a b Schoner, R.W.; Molansky, S.; Weeks, Sinclair, Reichelderfer, F.W.; Brucker, W.M.; Sturgis, S.D. Jr. (July 1956). Rainfall Associated With Hurricanes (And Other Tropical Disturbances) (PDF). National Hurricane Research Project Report (Report). Washington, D.C.: National Hurricane Research Project. pp. 4–5. Retrieved May 17, 2013.
{{cite report}}: CS1 maint: multiple names: authors list (link) - ^ a b c Burnett, Johnathan (2008). "September 1921 – Thrall Record Rainfall and Little River Flood". Flash Floods in Texas (Illustrated ed.). College Station, Texas: Texas A&M University Press. pp. 37–49. ISBN 9781585445905. Retrieved May 17, 2013.
- ^ a b Roth, David M. (January 17, 2010). Texas Hurricane History (PDF) (Report). Camp Springs, Maryland: United States National Oceanic and Atmospheric Administration's Weather Prediction Center. pp. 11, 39–40. Retrieved May 17, 2013.
- ^ Carnett, Lindsey (2018-05-25). "SA Gears: A look inside Olmos Dam". mySA. Retrieved 2020-12-25.