Taquari
 From Wikipedia the free encyclopedia
City of Taquari | |
|---|---|
![Armenian Lagoon [Lagoa Armênia]](http://upload.wikimedia.org/wikipedia/commons/thumb/8/8f/Lagoa_Armenia.jpg/250px-Lagoa_Armenia.jpg) Armenian Lagoon [Lagoa Armênia] | |
| Nickname(s): Taquari, people's land | |
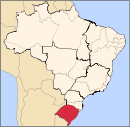
 Location in Rio Grande do Sul, Brazil | |
| Coordinates: 29°48′00″S 51°51′35″W / 29.80000°S 51.85972°W | |
| Country | Brazil |
| Region | South |
| State | Rio Grande do Sul |
| Founded | 1849 |
| Government | |
| • Mayor | Emanuel Hassen de Jesus (PT) |
| Area | |
| • Total | 349 km2 (135 sq mi) |
| Elevation | 54 m (177 ft) |
| Population (2020 [1]) | |
| • Total | 26,885 |
| Time zone | UTC−3 (BRT) |
| Website | Prefeitura de Taquary |
Taquari is a municipality in the state of Rio Grande do Sul, Brazil.
Climate
[edit]| Climate data for Taquari (1976–2005) | |||||||||||||
|---|---|---|---|---|---|---|---|---|---|---|---|---|---|
| Month | Jan | Feb | Mar | Apr | May | Jun | Jul | Aug | Sep | Oct | Nov | Dec | Year |
| Record high °C (°F) | 36.4 (97.5) | 35.7 (96.3) | 34.9 (94.8) | 32.2 (90.0) | 29.4 (84.9) | 28.0 (82.4) | 28.9 (84.0) | 30.2 (86.4) | 31.3 (88.3) | 33.3 (91.9) | 34.9 (94.8) | 36.0 (96.8) | 36.4 (97.5) |
| Mean daily maximum °C (°F) | 30.5 (86.9) | 30.0 (86.0) | 28.7 (83.7) | 25.3 (77.5) | 22.0 (71.6) | 19.3 (66.7) | 19.3 (66.7) | 20.4 (68.7) | 21.8 (71.2) | 24.7 (76.5) | 27.0 (80.6) | 29.3 (84.7) | 24.9 (76.7) |
| Daily mean °C (°F) | 24.9 (76.8) | 24.7 (76.5) | 23.4 (74.1) | 20.1 (68.2) | 16.8 (62.2) | 14.5 (58.1) | 14.5 (58.1) | 15.3 (59.5) | 16.8 (62.2) | 19.4 (66.9) | 21.4 (70.5) | 23.6 (74.5) | 19.6 (67.3) |
| Mean daily minimum °C (°F) | 19.3 (66.7) | 19.4 (66.9) | 18.2 (64.8) | 14.9 (58.8) | 11.7 (53.1) | 9.7 (49.5) | 9.6 (49.3) | 10.2 (50.4) | 11.8 (53.2) | 14.1 (57.4) | 15.8 (60.4) | 17.8 (64.0) | 14.4 (57.9) |
| Record low °C (°F) | 13.5 (56.3) | 13.9 (57.0) | 12.0 (53.6) | 7.6 (45.7) | 4.0 (39.2) | 1.3 (34.3) | 1.1 (34.0) | 2.3 (36.1) | 4.0 (39.2) | 7.0 (44.6) | 9.4 (48.9) | 12.0 (53.6) | 1.1 (34.0) |
| Average precipitation mm (inches) | 148 (5.8) | 127 (5.0) | 118 (4.6) | 116 (4.6) | 117 (4.6) | 124 (4.9) | 149 (5.9) | 123 (4.8) | 149 (5.9) | 179 (7.0) | 131 (5.2) | 135 (5.3) | 1,616 (63.6) |
| Average relative humidity (%) | 77 | 79 | 81 | 84 | 85 | 86 | 85 | 83 | 81 | 79 | 75 | 74 | 81 |
| Source 1: Empresa Brasileira de Pesquisa Agropecuária (EMBRAPA)[2] | |||||||||||||
| Source 2: Climatempo (precipitation)[3] | |||||||||||||
See also
[edit]References
[edit]- ^ IBGE 2020
- ^ "Atlas climático da Região Sul do Brasil: Estados do Paraná, Santa Catarina e Rio Grande do Sul" (PDF). EMBRAPA. Archived from the original (PDF) on 14 January 2024. Retrieved 25 May 2024.
- ^ "Climatologia em Taquari, BR". Climatempo. Retrieved 25 May 2024.


